Estimating Stress Levels Using Only Consumer Smartwatches
A validation study of 1 Hz heart rate for binary stress classification

Motivation
Why stress, why now
A rising problem
Chronic stress affects 25–40% of working adults (Eurofound 2021), and is causally linked to cardiovascular disease and immune dysfunction (McEwen 2007).
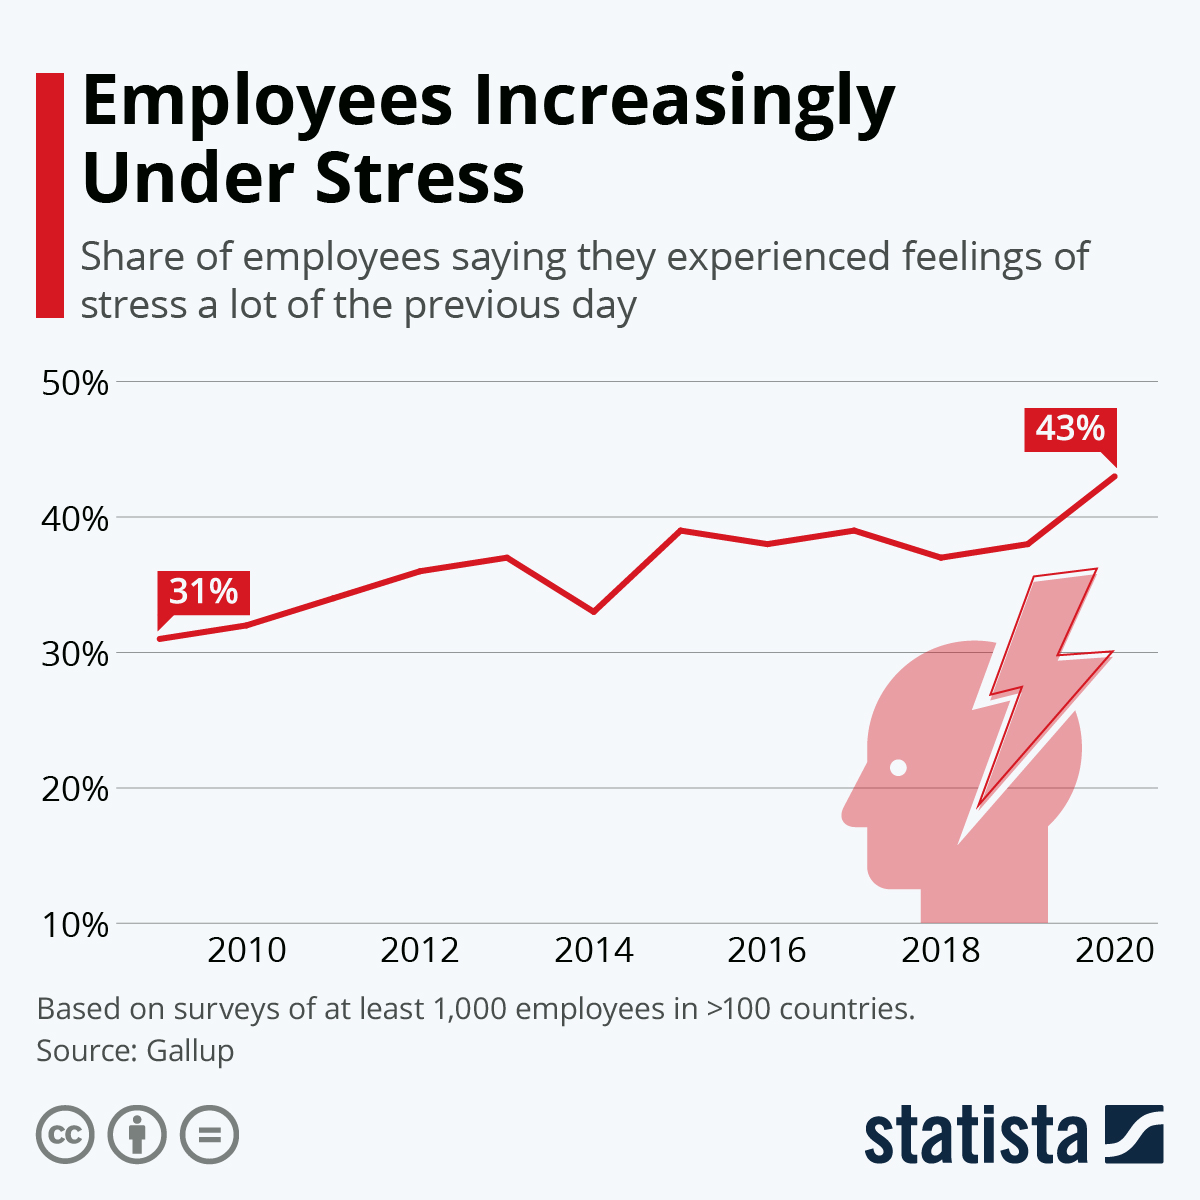
Self-reported daily stress climbed 31% → 43% over the decade to 2020.
A device already on every wrist
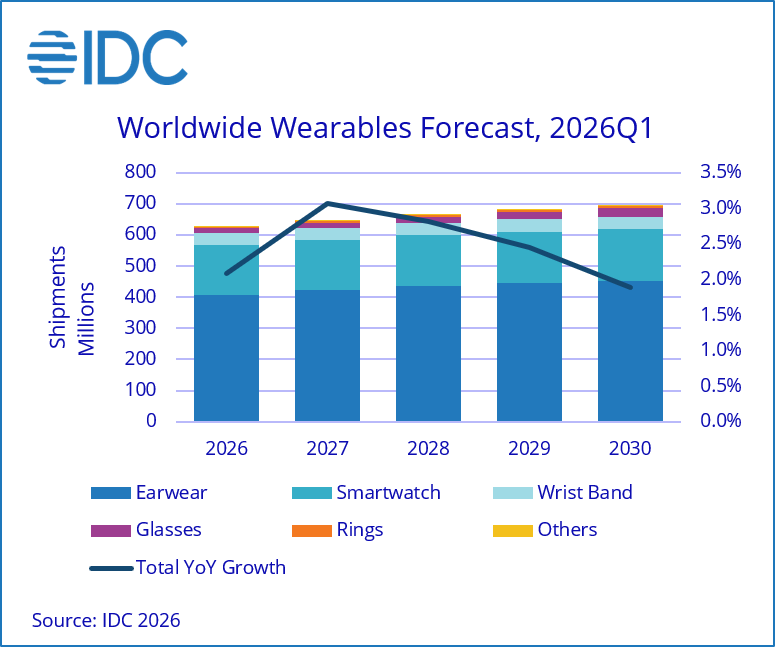
Wearables are ubiquitous and always-on: 611 M units shipped in 2025, forecast to grow toward ~690 M by 2030 (IDC), smartwatches a leading segment.
The platform to measure stress at population scale already exists.
The constraint
What 1 Hz Heart Rate Loses
Same 60-second WESAD window, two very different signals
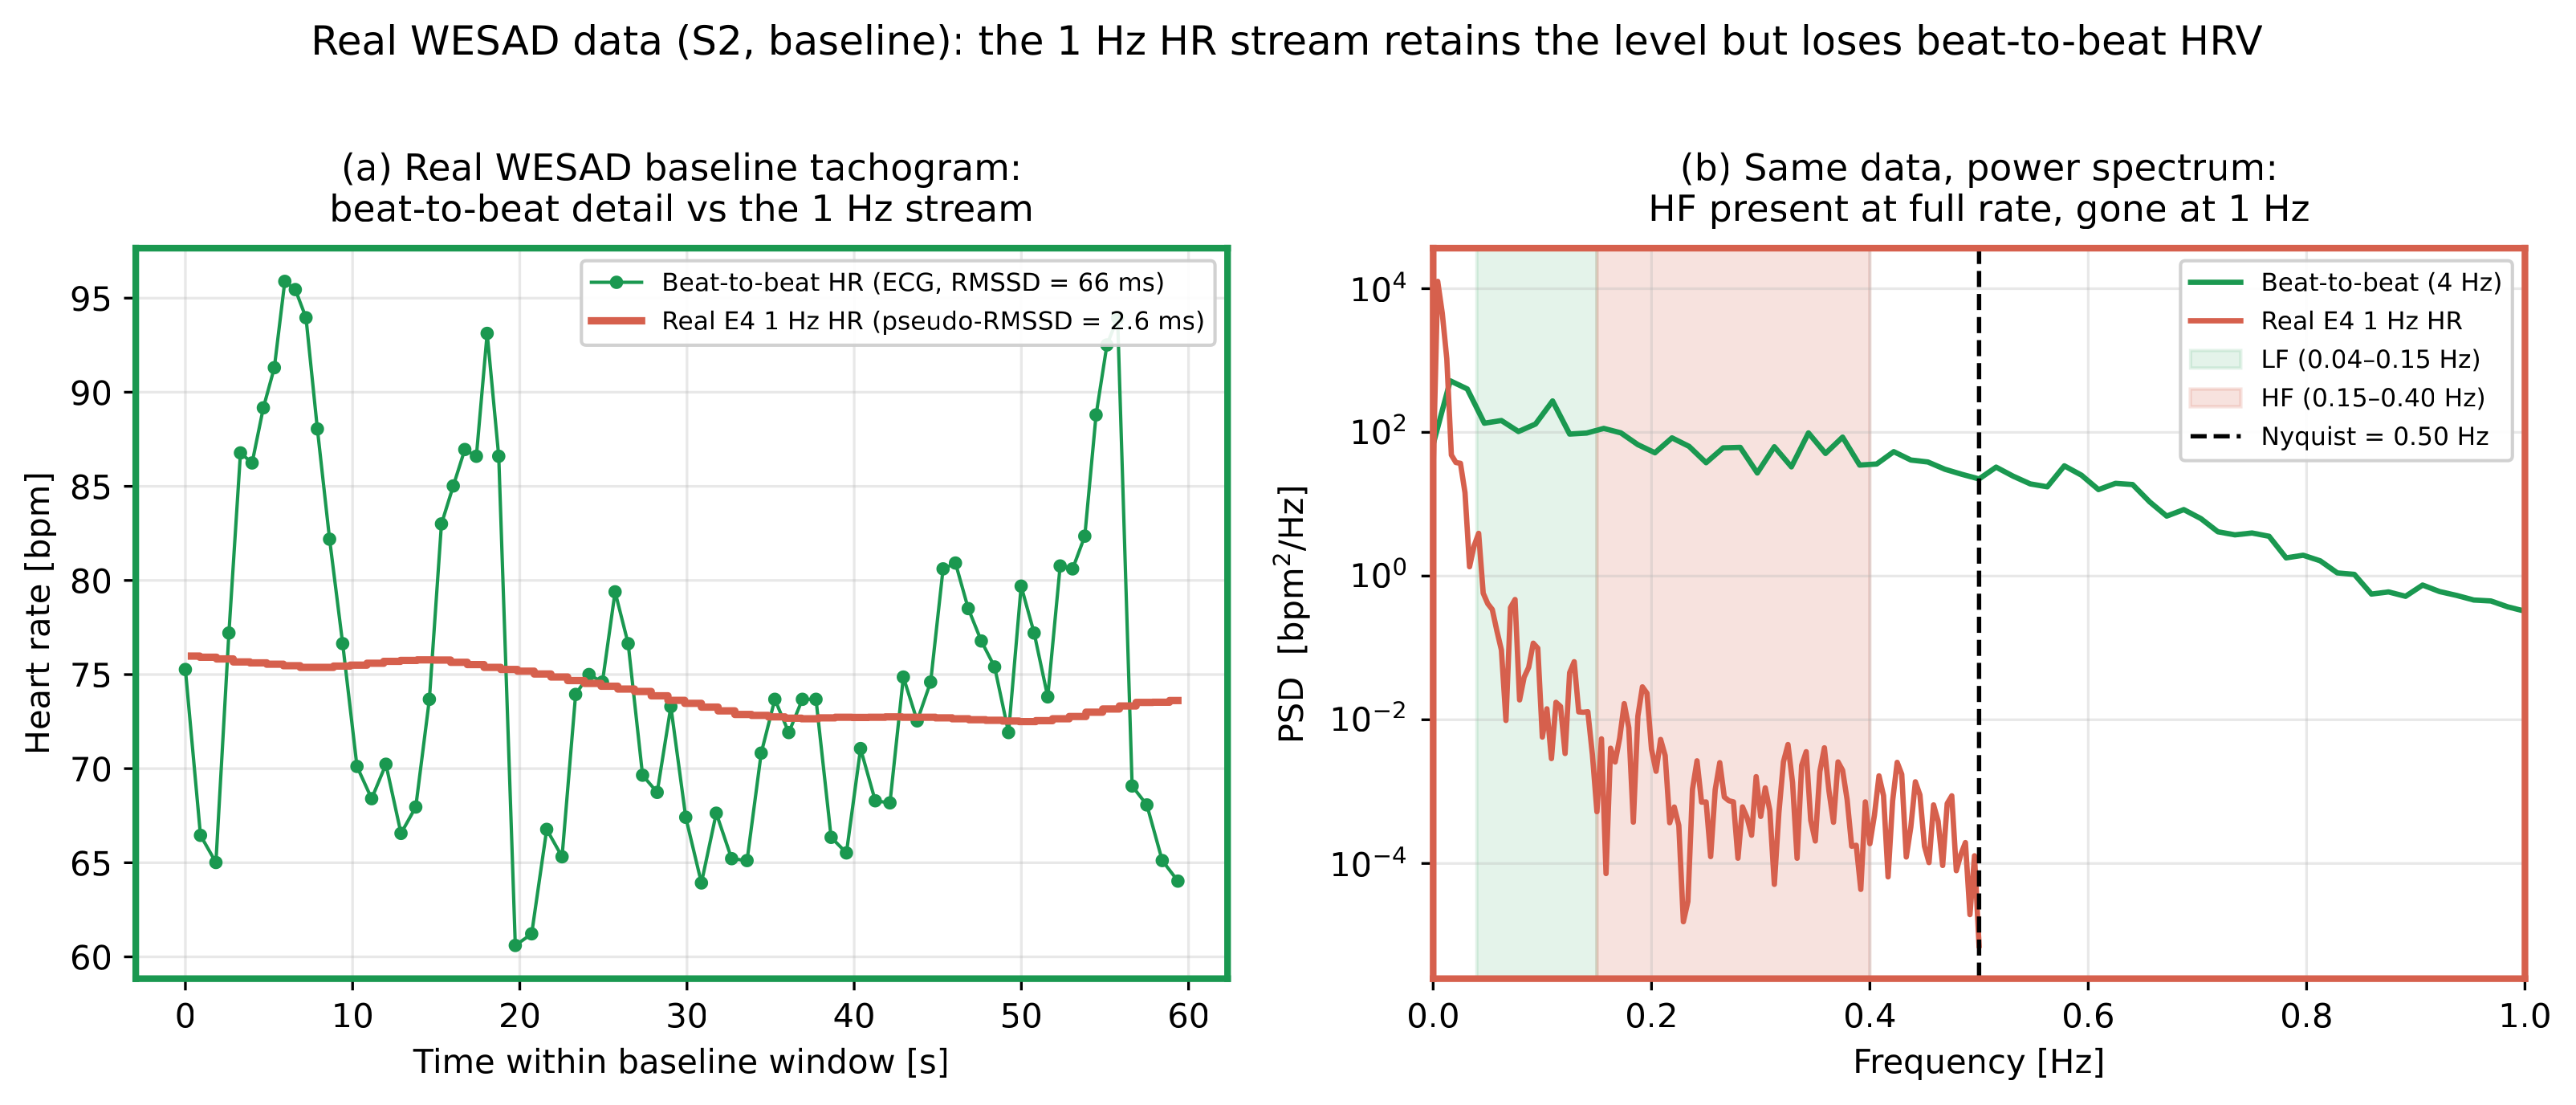
ECG
RMSSD ≈ 66 ms
1 Hz (pseudo)
RMSSD ≈ 2.6 ms
Mean HR level partly survives. Beat-to-beat HRV structure does not.
Scope
Research question + three hard constraints
Can meaningful stress information be extracted from 1 Hz HR alone, with no ECG / PPG?
Signal
1 Hz averaged HR: the only stream every device exposes.
Validation
Must check against ECG-HRV ground truth (Bland-Altman, ICC, effect size).
Generalisability
LOSO-CV: test on subjects never seen in training.
Position
Related work
Physiology: why HR is the only channel
sympatho-adrenal seconds ; HR +15–25 bpm
watch CAN see
cortisol 15–30 min ; saliva/blood
inaccessible
Prior work, by required signal detail
Data landscape
Available stress datasets
Very few open datasets pair a validated stress protocol with chest ECG and a wrist signal on the same subjects.
| Dataset | N | Stressor / protocol | Chest ECG | Wrist signal |
|---|---|---|---|---|
| SWELL-KW | 25 | Work overload + interruption (office task) | ✓ | ✗ |
| DriveDB | 17 | Simulated driving | ✓ | ✗ |
| AffectiveROAD | 15 | Real-road driving | ✗ | ✓ |
| Nurses' Stress Dataset | 15 | 24 h work shift (ambulatory) | ✗ | ✓ |
| WESAD | 15 | TSST (validated lab protocol) | ✓ | ✓ |
WESAD is the only one offering all three on the same subjects: a laboratory-validated stressor, chest ECG ground truth, and a wrist signal. These are the ingredients this thesis needs for both the agreement analysis and the 1 Hz classification task.
Empirical substrate
WESAD dataset
| Datasets / protocol | Value |
|---|---|
| Subjects (S12 excluded) | 15 (12 👨 / 3 👩) |
| Chest ECG (ground truth) | 700 Hz |
| Wrist signal | Empatica E4 BVP, 64 Hz |
| Stressor | Trier Social Stress Test (validated) |
| Binary windows (60 s, 30 s stride) | 919 total · base / stress |
| Class balance |
TSST: Trier Social Stress Test
A validated laboratory stressor (Kirschbaum 1993). Two main phases before an evaluative panel:
Baseline
5–15 min rest, seated
Anticipation
speech preparation
Mock interview
5 min, free speech, evaluators
Serial arithmetic
5 min, 1024 − ... publicly
Recovery
rest
Drives reliable +15–25 bpm sympathetic tachycardia + cortisol surge. The cardiac signal the watch can in principle see. Social-evaluative threat → SAM + HPA co-activation.
Why 15 subjects, not 16?
WESAD recorded 16 subjects; S12 excluded here for data quality (sustained ECG / wrist-signal artefact in the relevant windows). 15 usable.
Applied consistently across agreement, effect-size, and LOSO classification analyses.
Feature set
The 8 pseudo-HRV features
60 s windows, 30 s stride. HR → pseudo-IBI: \(\text{IBI} \approx 60000 / \text{HR}\).
| Class | Feature |
|---|---|
| Level | mean HR |
| mean pseudo-IBI | |
| Dispersion | \(\sigma_{HR}\) |
| HR range | |
| \(CV_{HR}\) | |
| \(\sigma_{\text{pseudo-IBI}}\) (SDNN proxy) | |
| Dynamics | HR slope |
| pseudo-RMSSD |
"pseudo-" is not cosmetic: these are 1 Hz HR statistics, not clinical HRV (Camm et al. 1996).
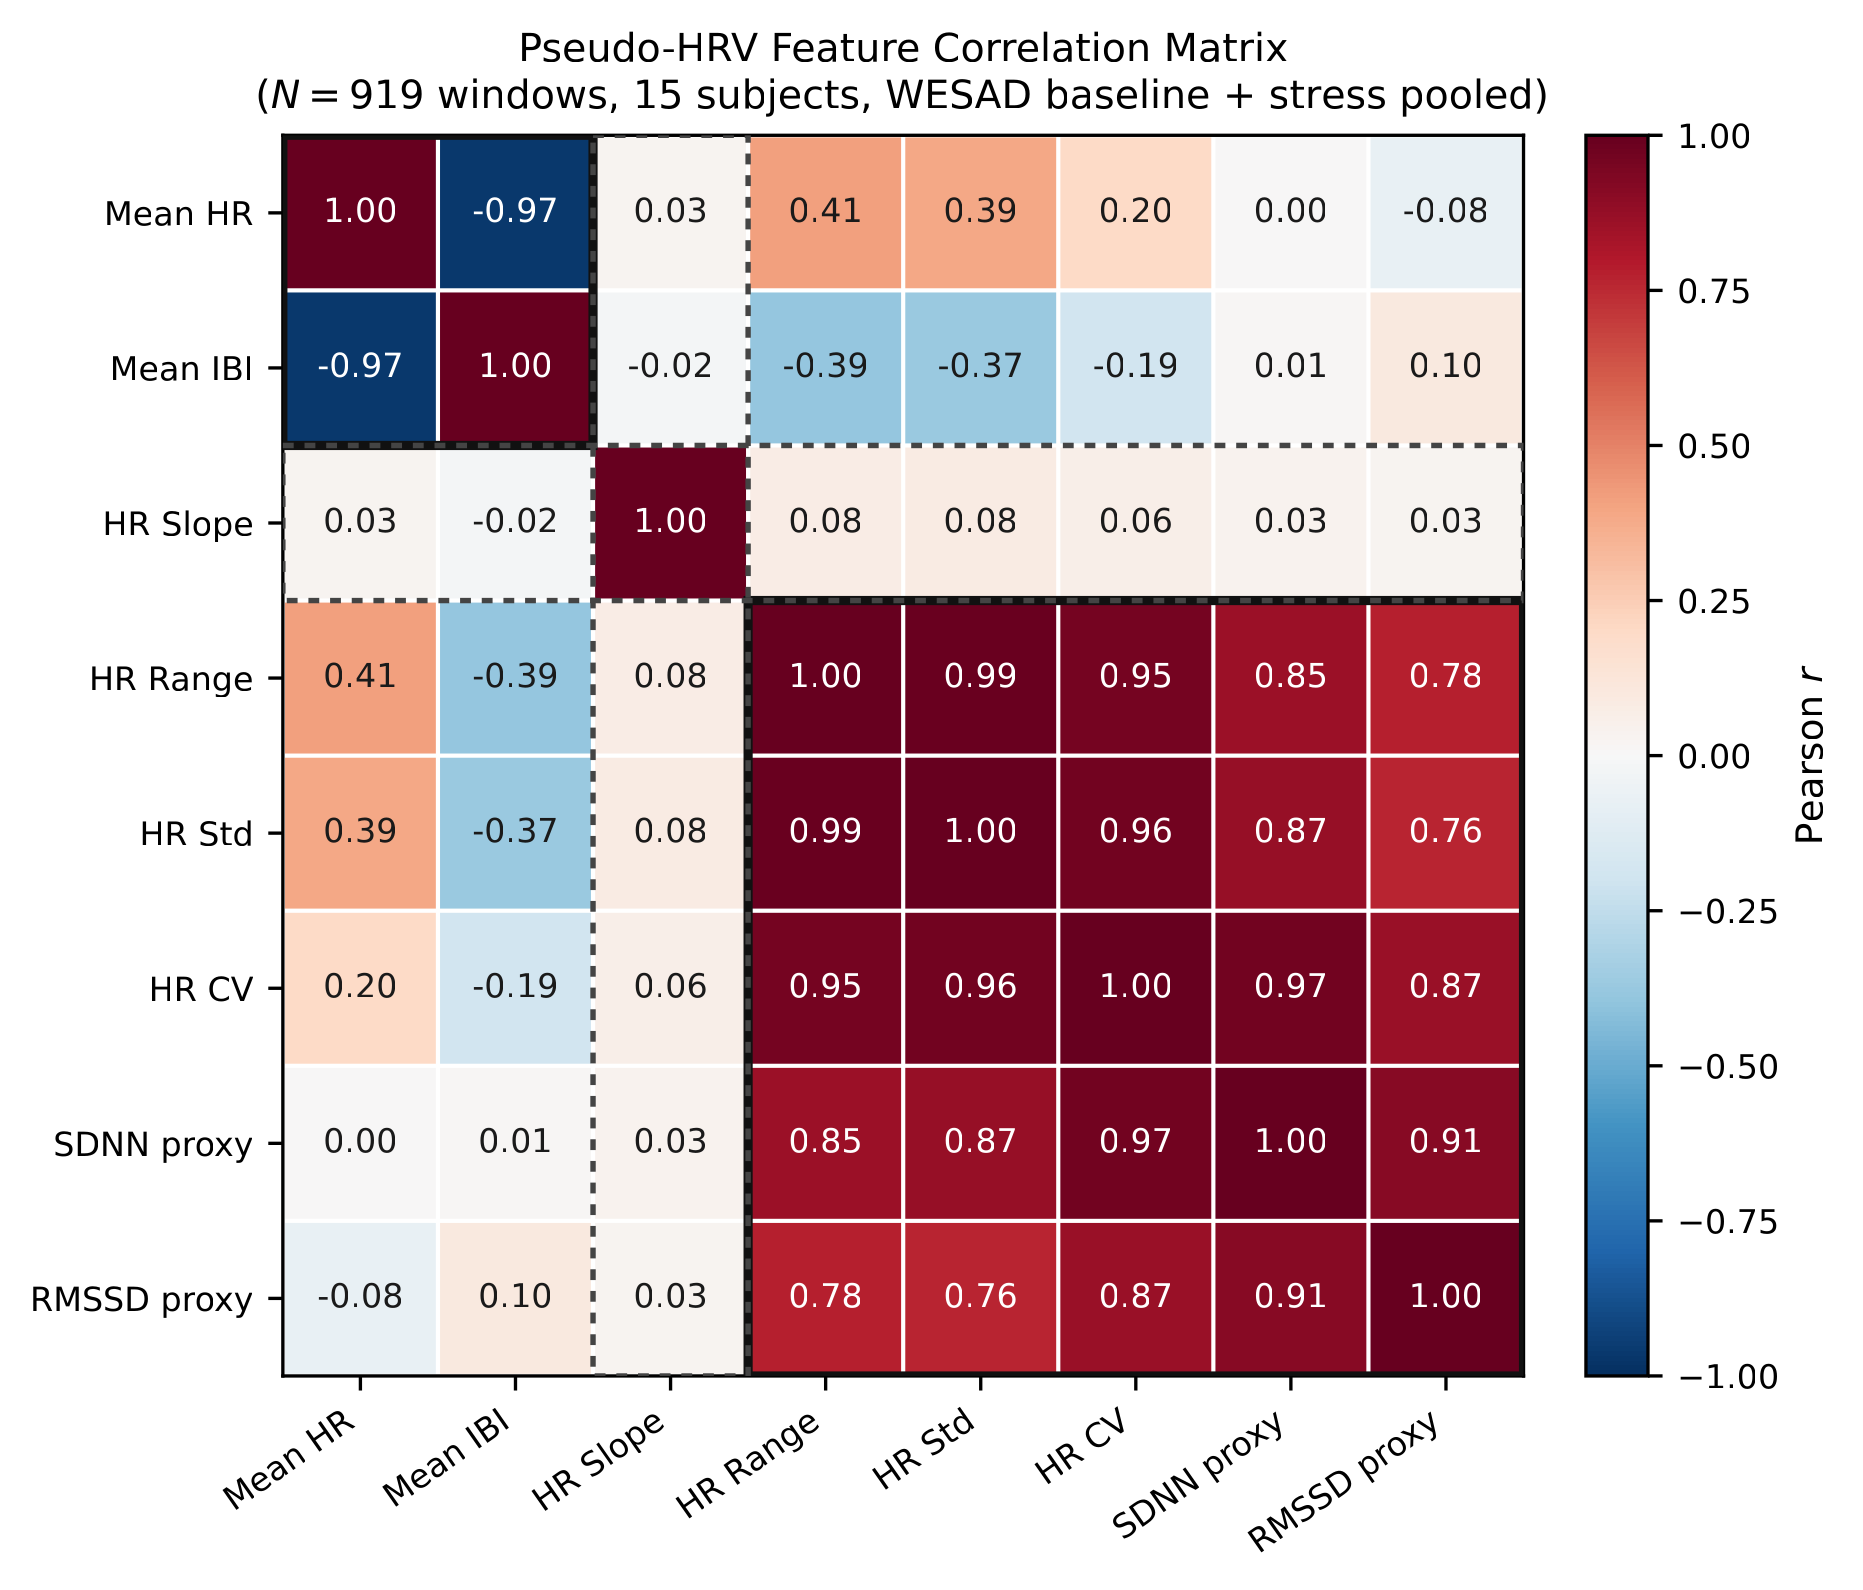
The 8 features collapse to ≈ 3 effective axes: level / dispersion / slope. Mean HR vs Mean IBI r = −0.985.
Why 60 s windows, 30 s stride?
Classical HRV uses 5-min stationary records, but at 1 Hz that is 300 samples per window, and the TSST stress phase is shorter than 5 min. 60 s balances: enough beats to estimate dispersion, short enough to track state change. 50% overlap → CIs bootstrap subjects, not windows.
8 features or 3? Gini importance
Pseudo-RMSSD is informationally inside the dispersion cluster (\(r \approx 0.77\text{–}0.91\) with \(\sigma_{HR}\) / range).
Methods
Method pipeline
Wrist / watch pathway
Empatica BVP
wrist 64 Hz
Peak detection
NeuroKit2
1 Hz HR downsample
Garmin-equivalent
Filters
range / successive-diff / gap
60 s windows
30 s stride
8 pseudo-HRV
features
LOSO-CV
SVM-RBF ; LR ; RF
ECG ground-truth pathway
ECG RR intervals
700 Hz chest
True HRV
RMSSD / SDNN / mean HR
Agreement
Bland-Altman ; ICC
Within-subject baseline normalisation enters before LOSO: baseline-only → no label leakage. Motion-gating tiers exist for real deployment; every WESAD window is low-motion, so the gate does not touch these numbers.
Statistical rigour
Validation framework
Bland-Altman
bias + limits of agreement; subject-cluster bootstrap CIs (5,000 resamples of subjects, not windows).
Applied per feature, pseudo-HRV vs ECG-HRV. Reports direction and magnitude of bias, not just significance.
ICC(2,1)
absolute agreement; Koo-Li bands (poor < 0.5 / moderate / good / excellent).
Two-way random-effects, single-measures. Penalises both bias and inconsistency between raters/methods.
Wilcoxon signed-rank
on subject means + Bonferroni α = 0.05 / 8 = 0.00625.
Non-parametric, so it makes no normality assumption across the 15 subject-level baseline-vs-stress differences.
Cohen's d
effect size (negligible 0.2 / medium 0.5 / large 0.8).
Computed on the cluster-bootstrap distribution, not pooled raw SD, which avoids inflating effect size from within-subject correlation.
LOSO-CV
subject-independent accuracy + AUC + balanced accuracy.
Three classifiers compared: SVM-RBF, Logistic Regression, Random Forest. Held-out subject never seen in training.
Calibration
Brier Skill Score; isotonic vs raw probabilities.
Checks whether predicted probabilities are trustworthy, not just whether the predicted class label is correct.
Result A, the honest negative
Pseudo-HRV ≠ ECG-HRV
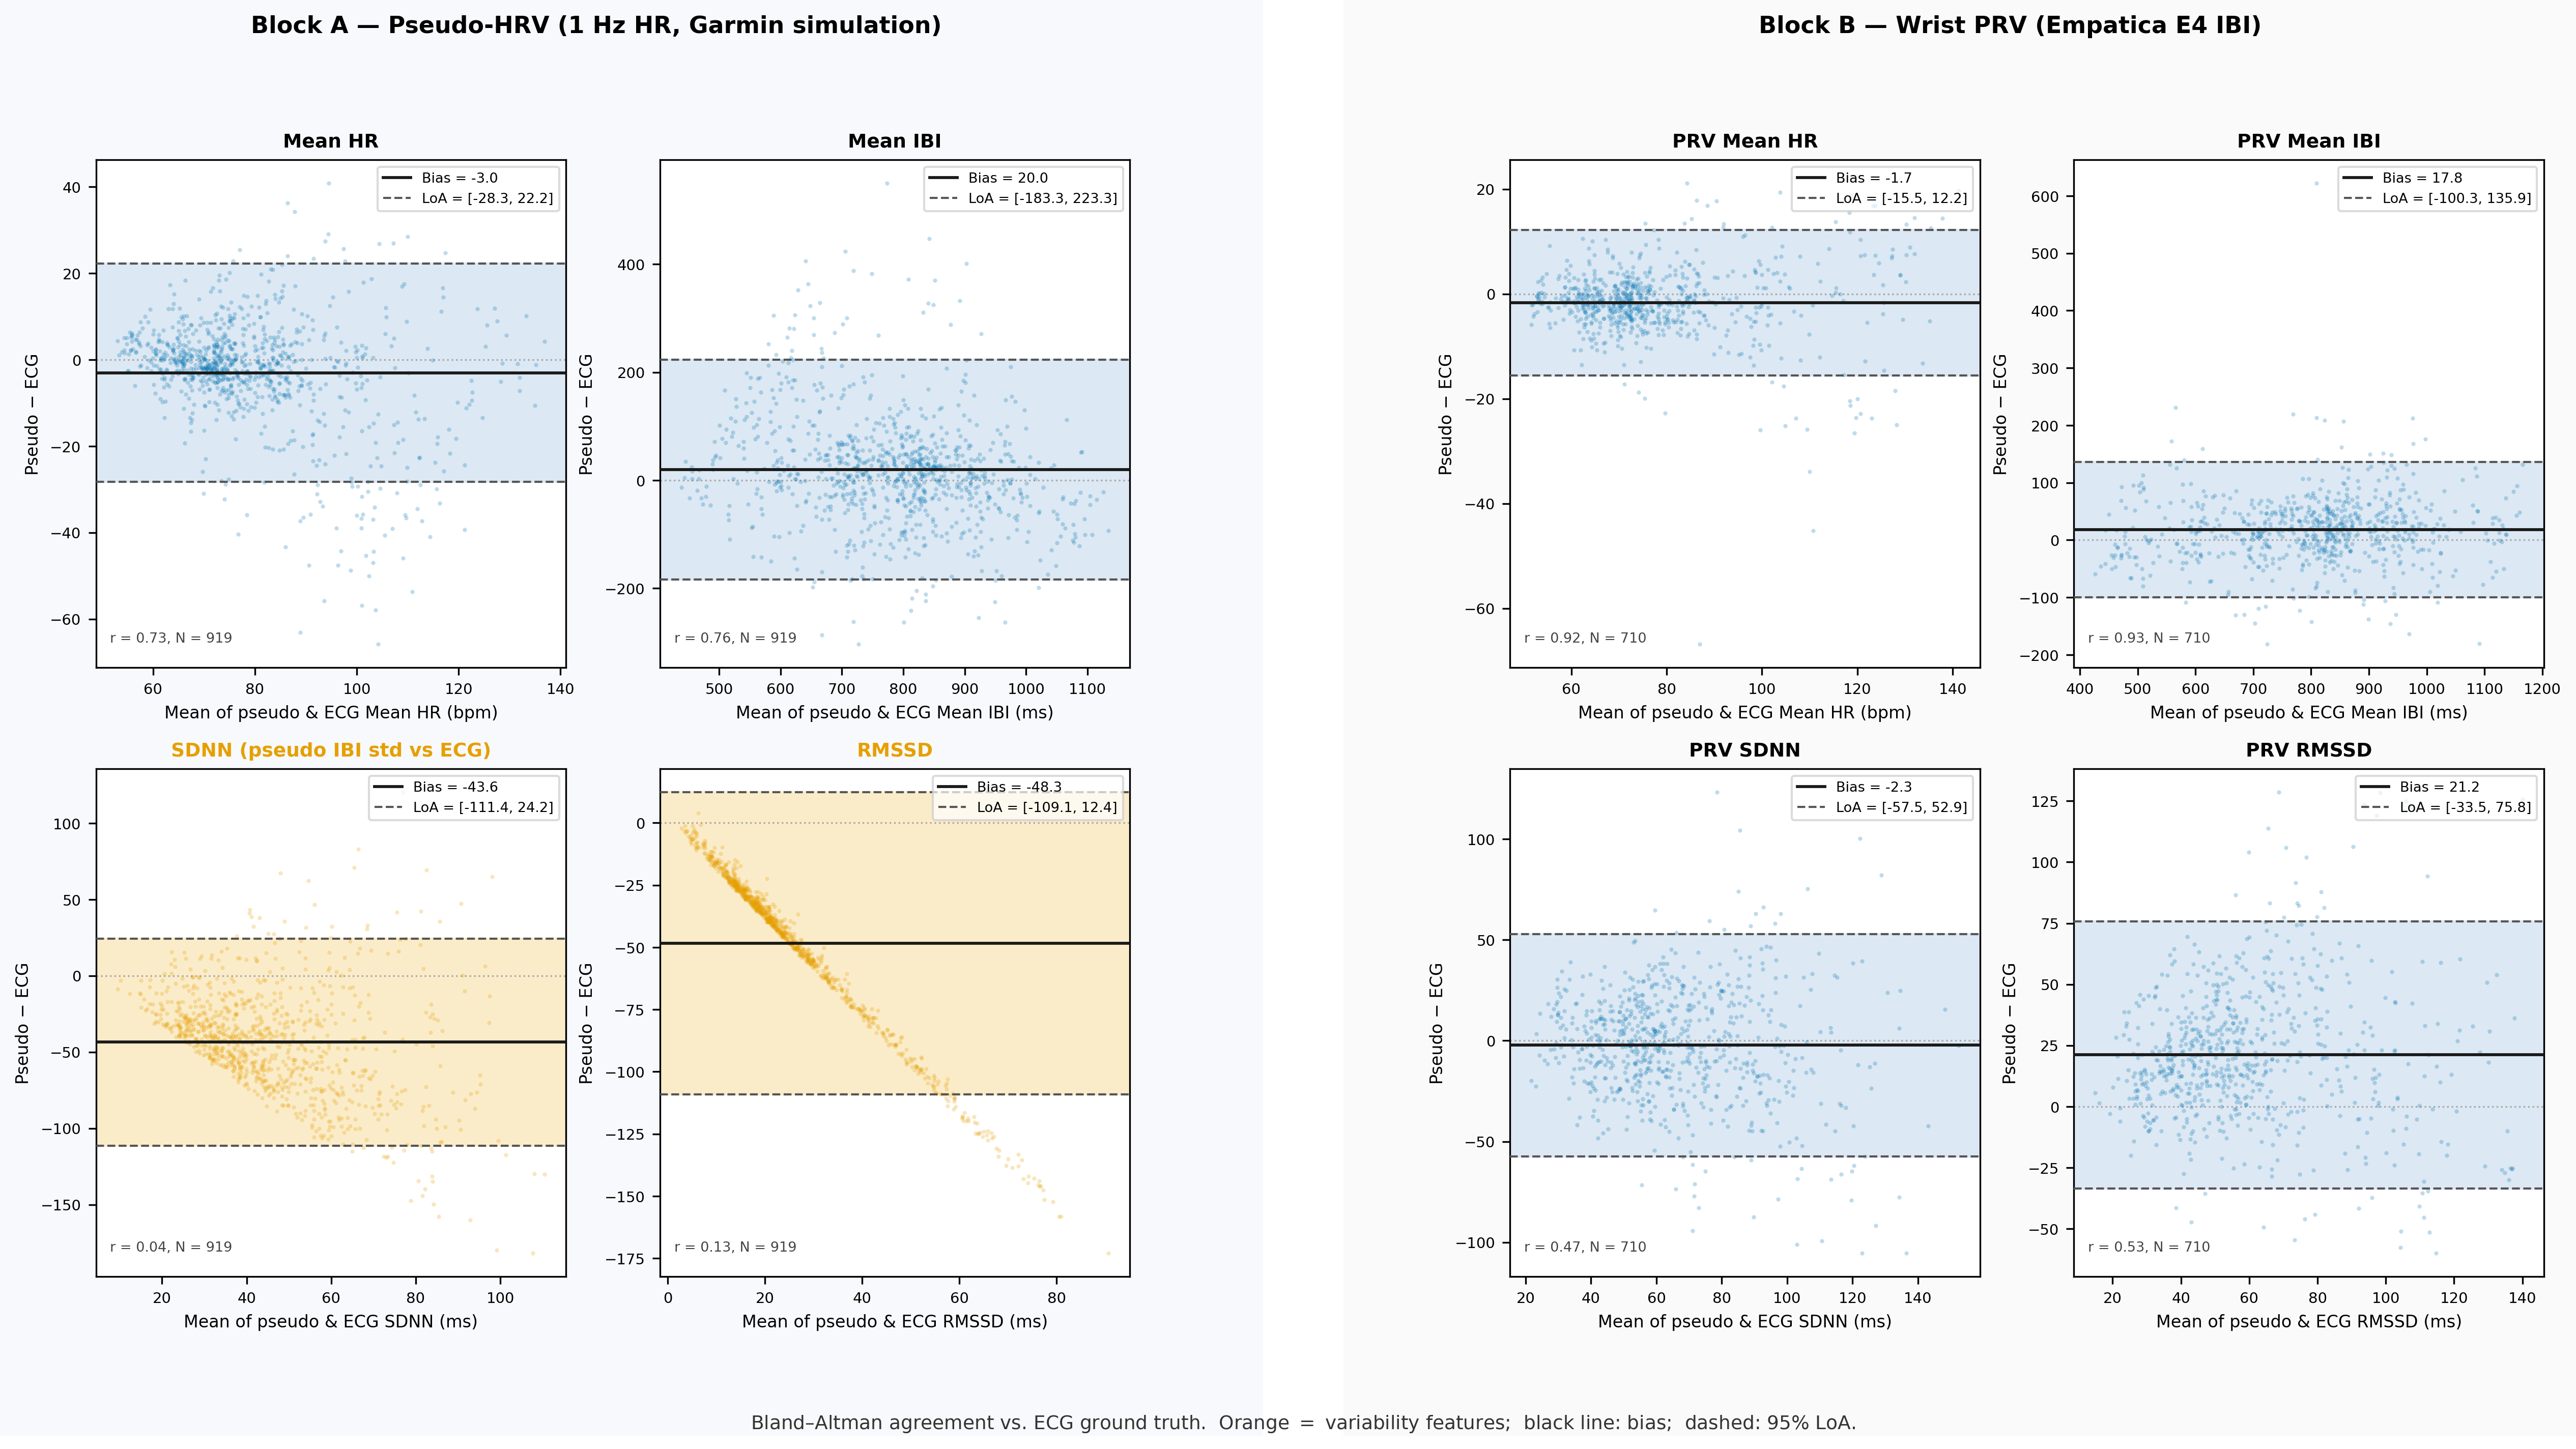
| Feature vs ECG | Bias | r | ICC(2,1) |
|---|---|---|---|
| Mean HR | −3.04 bpm | 0.73 | ≈ 0.70 (pooled) |
| Mean pseudo-IBI | +20 ms | 0.76* | ≈ 0.74* |
| \(\sigma_{\text{pseudo-IBI}}\) vs SDNN | large | low | 0.02 |
| pseudo-RMSSD vs RMSSD | > 120 ms LoA | 0.13 | 0.00 |
* mostly arithmetic inverse of HR; not an independent HRV signal
For absolute HRV measurement, the 1 Hz stream fails, and we can say exactly by how much.
Pooled ICC 0.70 but median 0.40: why?
The pooled ICC absorbs between-subject HR spread (different people sit at different resting HR).
It reflects ranking different people similarly, not tracking within-person state changes. Strip the between-subject variance and the median per-subject ICC falls to 0.40.
So even mean HR is not window-level interchangeable with ECG.
What could a better wrist signal do?
Wrist PRV from the raw 64 Hz Empatica signal (not downsampled):
| Metric (wrist PRV vs ECG) | r | Band |
|---|---|---|
| Mean HR | 0.92 (vs pseudo 0.73) | Strong |
| SDNN | 0.47–0.53 | Moderate |
| RMSSD | 0.47–0.53 | Moderate |
A 64 Hz wrist signal partly recovers variability, but Garmin does not expose it to third parties.
Result B, the positive
Discrimination survives
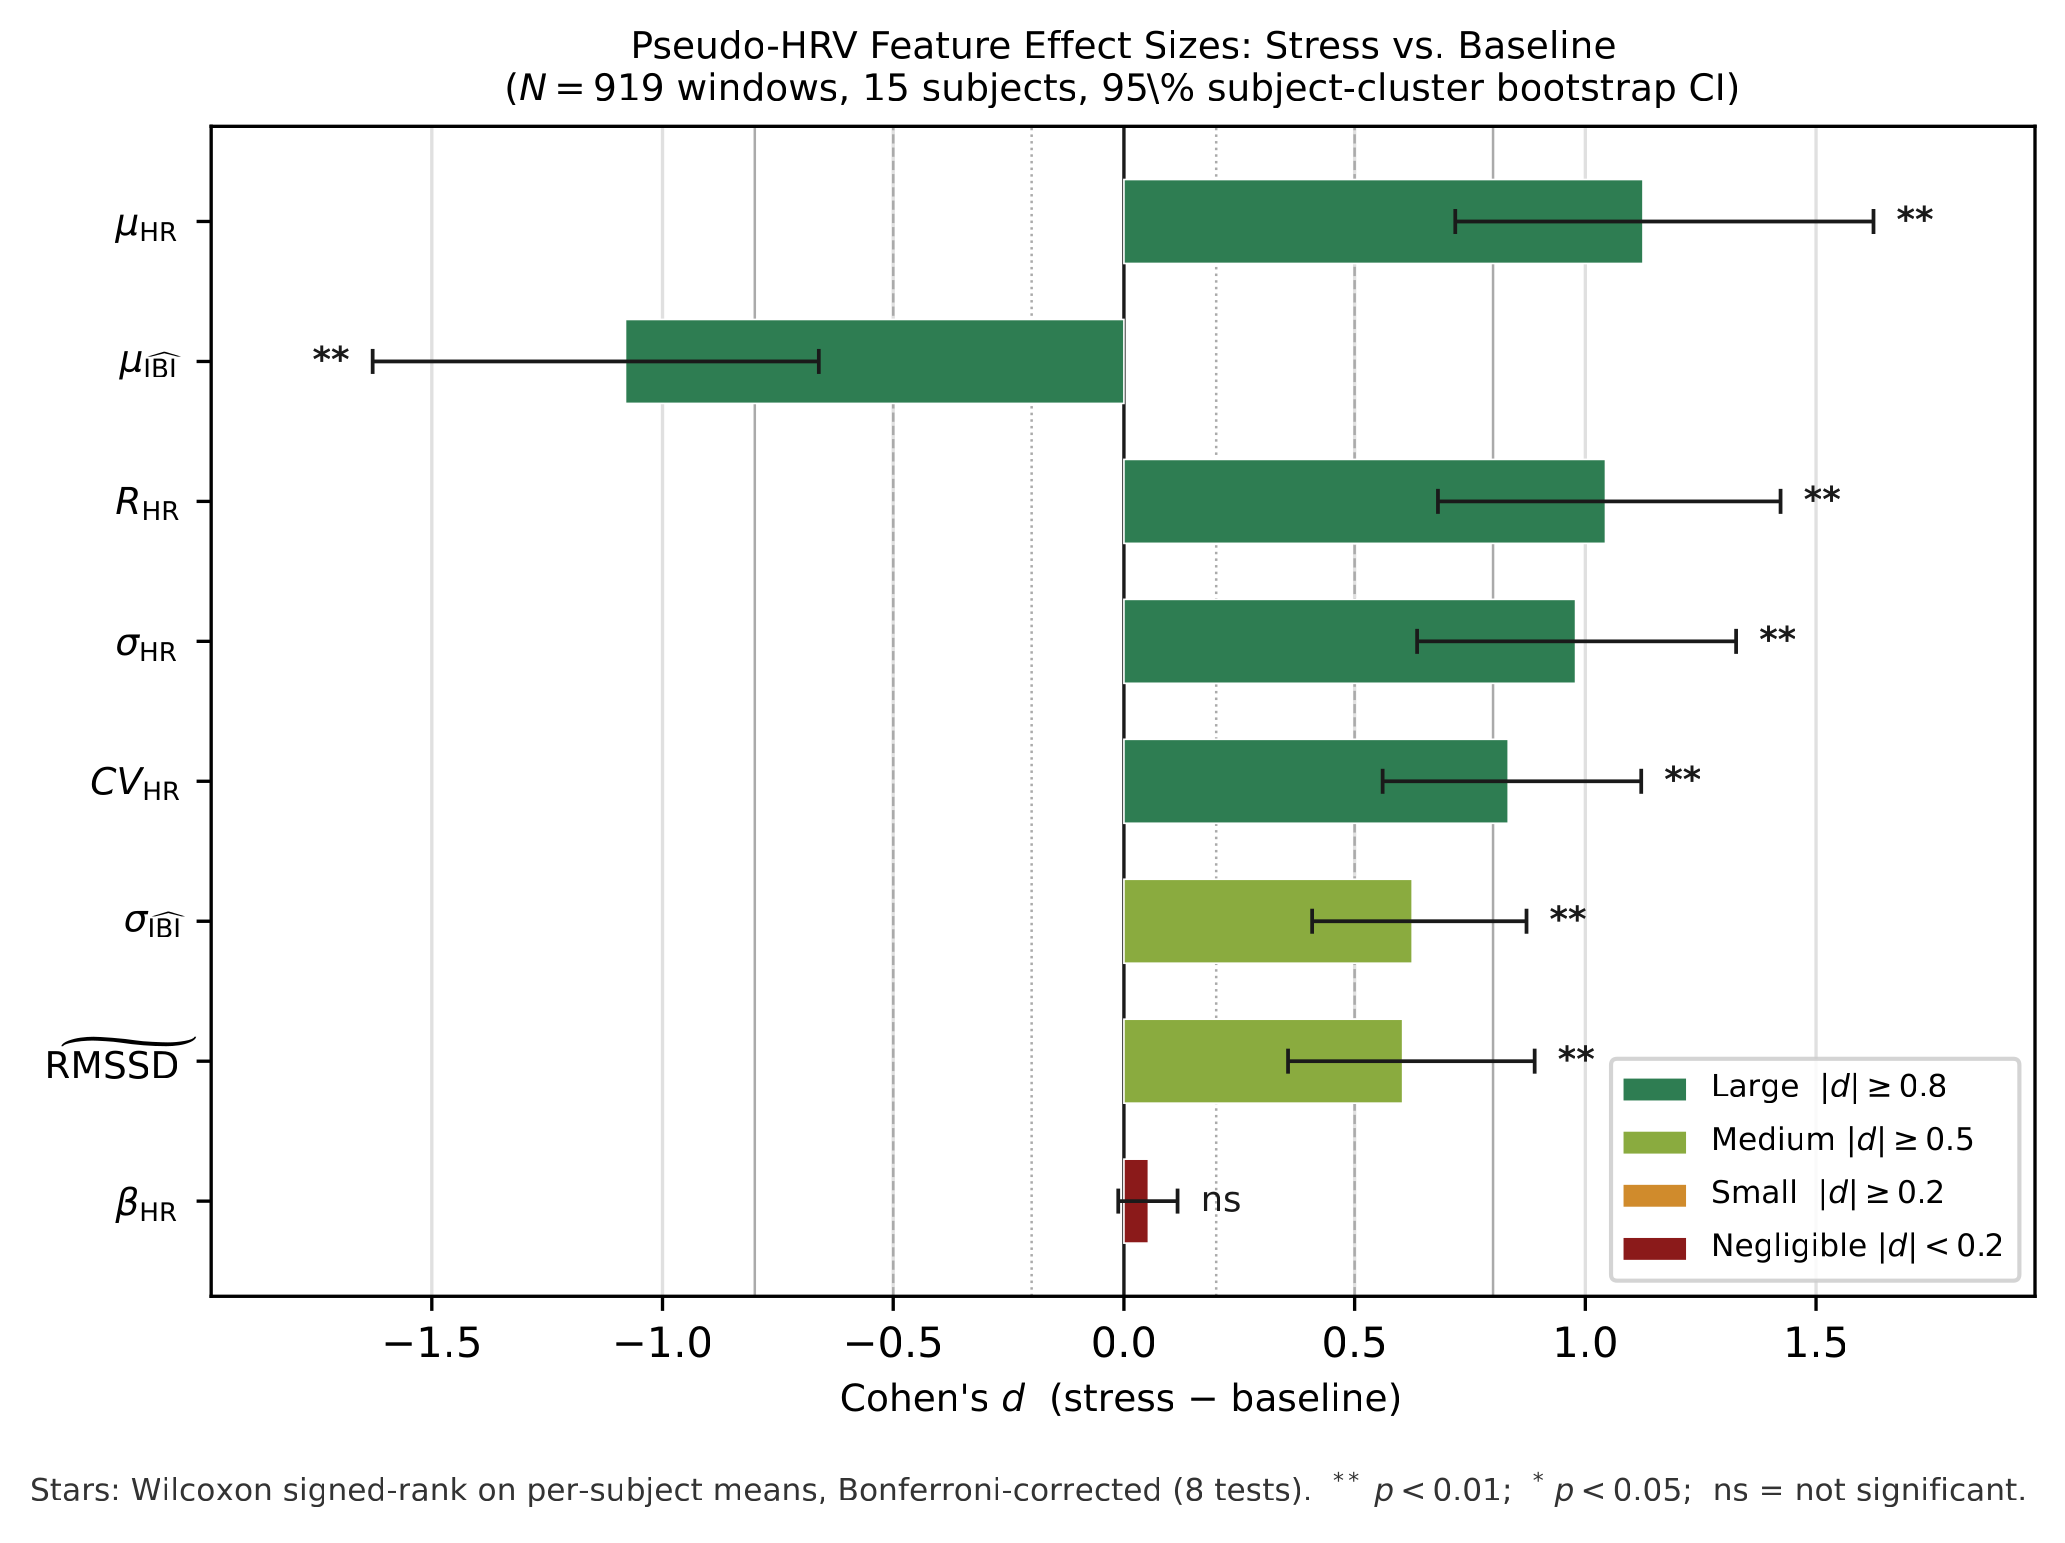
7 of 8 features pass Bonferroni-corrected Wilcoxon.
| Feature | Δ stress − base | |d| |
|---|---|---|
| Mean HR | +11.4 bpm | 1.13 |
| HR range | ↑ | 1.04 |
| \(\sigma_{HR}\) | ↑ | 0.98 |
| \(CV_{HR}\) | ↑ | 0.83 |
| Mean pseudo-IBI | −66 ms | 1.08 |
| \(\sigma_{\text{pseudo-IBI}}\) | ↑ | 0.63 |
| pseudo-RMSSD | ↑ | 0.60 |
| HR slope | ≈ 0 | 0.05 |
Conceptual centrepiece
Why both are true: the paradox
Agreement and classification answer different questions.
"Do the two numbers match?"
Absolute match: FAIL ×
pseudo-RMSSD vs ECG RMSSD: r = 0.13, ICC = 0.00
"Does it move the right way within a person?"
Within-person direction: PASS ✓
pseudo-RMSSD stress vs baseline: |d| = 0.60
At 1 Hz, pseudo-RMSSD physically measures within-window HR dispersion, not vagal tone, which is why it tracks σ_HR (r ≈ 0.8), not ECG RMSSD.
We are not claiming to measure HRV; we are detecting the direction of sympathetic arousal.
Why keep pseudo-RMSSD at all?
Discriminative at window level (d = 0.60) but informationally redundant with σ_HR / HR range (r ≈ 0.77–0.91).
Dropped for deployment at only −1.1 pp cost. Kept in the paper to complete the agreement story: without it the "pseudo" honesty argument has a hole.
Result C, the headline
LOSO classification
| Model | Features | Balanced acc. | AUC |
|---|---|---|---|
| SVM-RBF | 8 | 79.32% ± 16.32 | 86.23% |
| Logistic Regression | 8 | 79.31% | 86.82% |
| Random Forest | 8 | 75.06% ± 16.89 | 85.41% |
| SVM-RBF (drop pseudo-RMSSD) | 7 | 78.18% | 86.55% |
| Single ΔmeanHR only | 1 | 77.0% | 84.4% |
| +1 dispersion feature | 2 | 78.0% | 86.03% |
Most of this is a calibrated tachycardia detector. The other five features add ≈ 1 pp. Context: WESAD wrist 70.0% (3-class), not like-for-like.
One feature → 77%
A single within-subject z-scored mean-HR feature already reaches 77.0% BA / 84.4% AUC. Add one dispersion feature → 78.0%. The five IBI/variability features together add ≈ 1 pp.
How does this compare?
| Work | Signal | Task | Eval | Score |
|---|---|---|---|---|
| Gjoreski 2016 | PPG+EDA+ACC | binary | within-subj | 92% |
| Schmidt 2018 (WESAD) | BVP+EDA+temp | 3-class | LOSO | 70.0% |
| This thesis | 1 Hz HR only | binary | LOSO | 79.3% BA |
Different task, different signal, different evaluation: not a direct comparison, only context.
The biggest lever
Personalisation > model choice
Same SVM, same 7-feature set, same LOSO folds. Only the z-score reference used to normalise HR changes.
+4.4 pp BA, +6.1 pp AUC from switching the reference alone: bigger than the entire SVM-vs-Random-Forest gap (4.3 pp).
"Is 90 bpm high?" → "Is this 10 bpm above YOUR baseline?"
Person A rests at 60, stresses to 70. Person B rests at 80: same absolute 70-ish, opposite states. Pooled normalisation can't tell them apart; own-baseline normalisation can.
Deployment consequence: every real user needs a rest-baseline calibration step before classification can run at all.
≈ 5 min proposed (low end of WESAD's 5–15 min rest), but not empirically validated as a minimum; flagged as open.
Honest failure mode
Per-subject heterogeneity
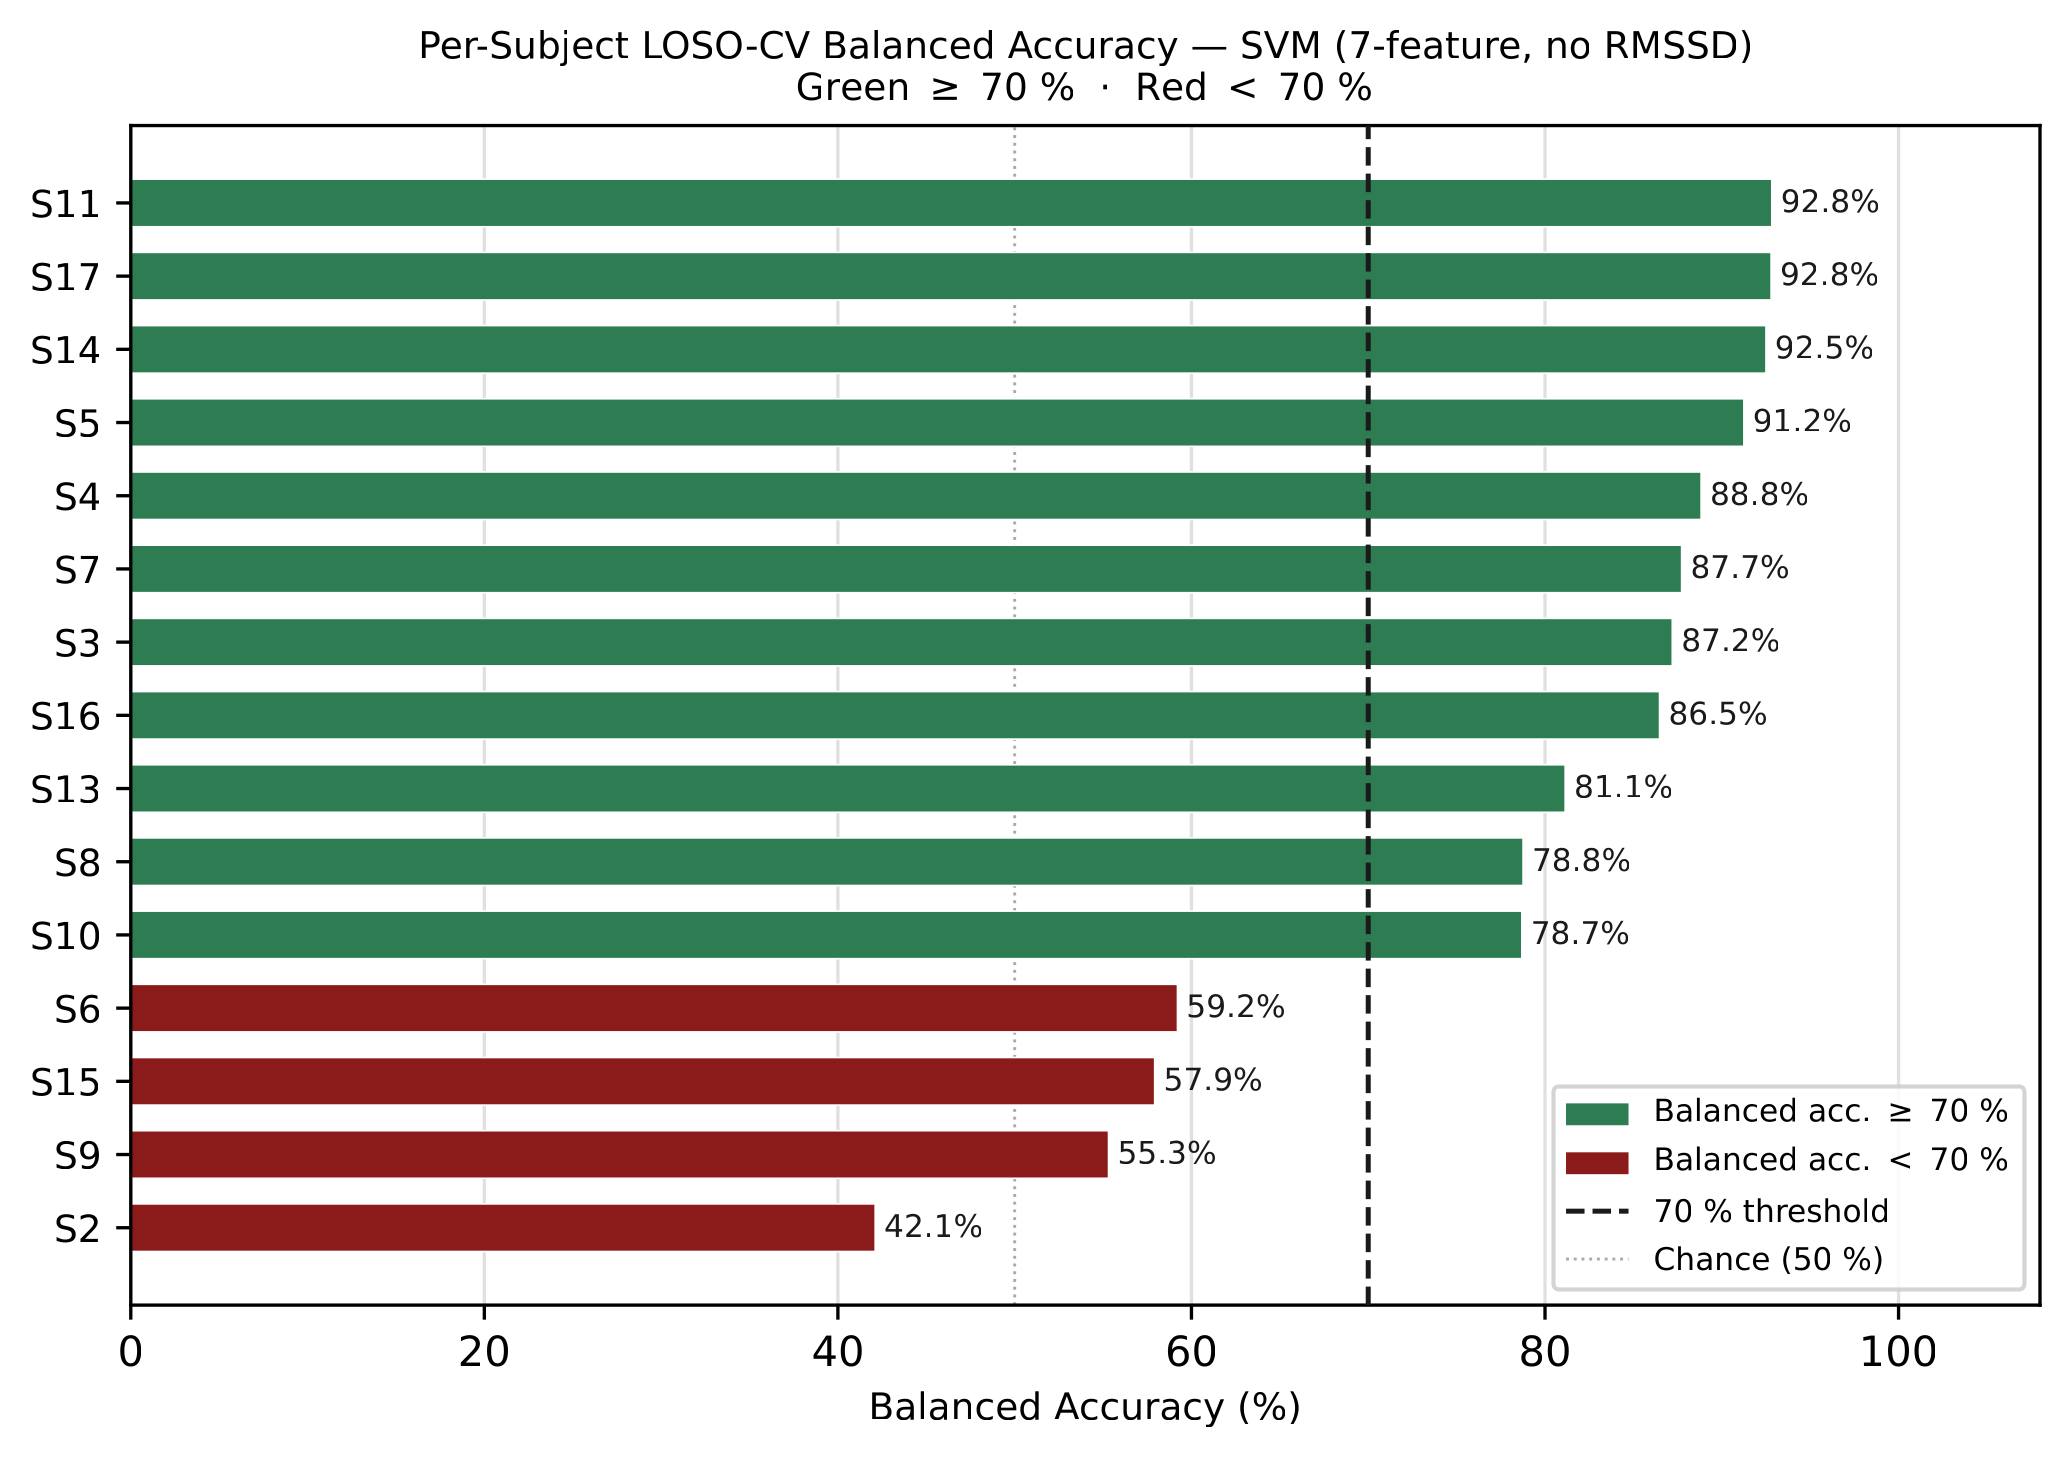
Per-subject balanced accuracy ranges 42.11% (S2) → 92.83% (S11), a 50.7 pp spread, the central empirical finding.
- 11 / 15 above 70%.
- 4 near or below chance (S2, S9, S15, S6).
- ~25% of users would get unreliable output with no warning.
- S2 AUC = 55%: the signal itself is weak, not a threshold problem (no model recovers what the stream doesn't contain).
Plausibly ~15–20% of healthy people are blunted responders (Dickerson 2004).
Confidence cross-check
Calibration + ARIMA confidence
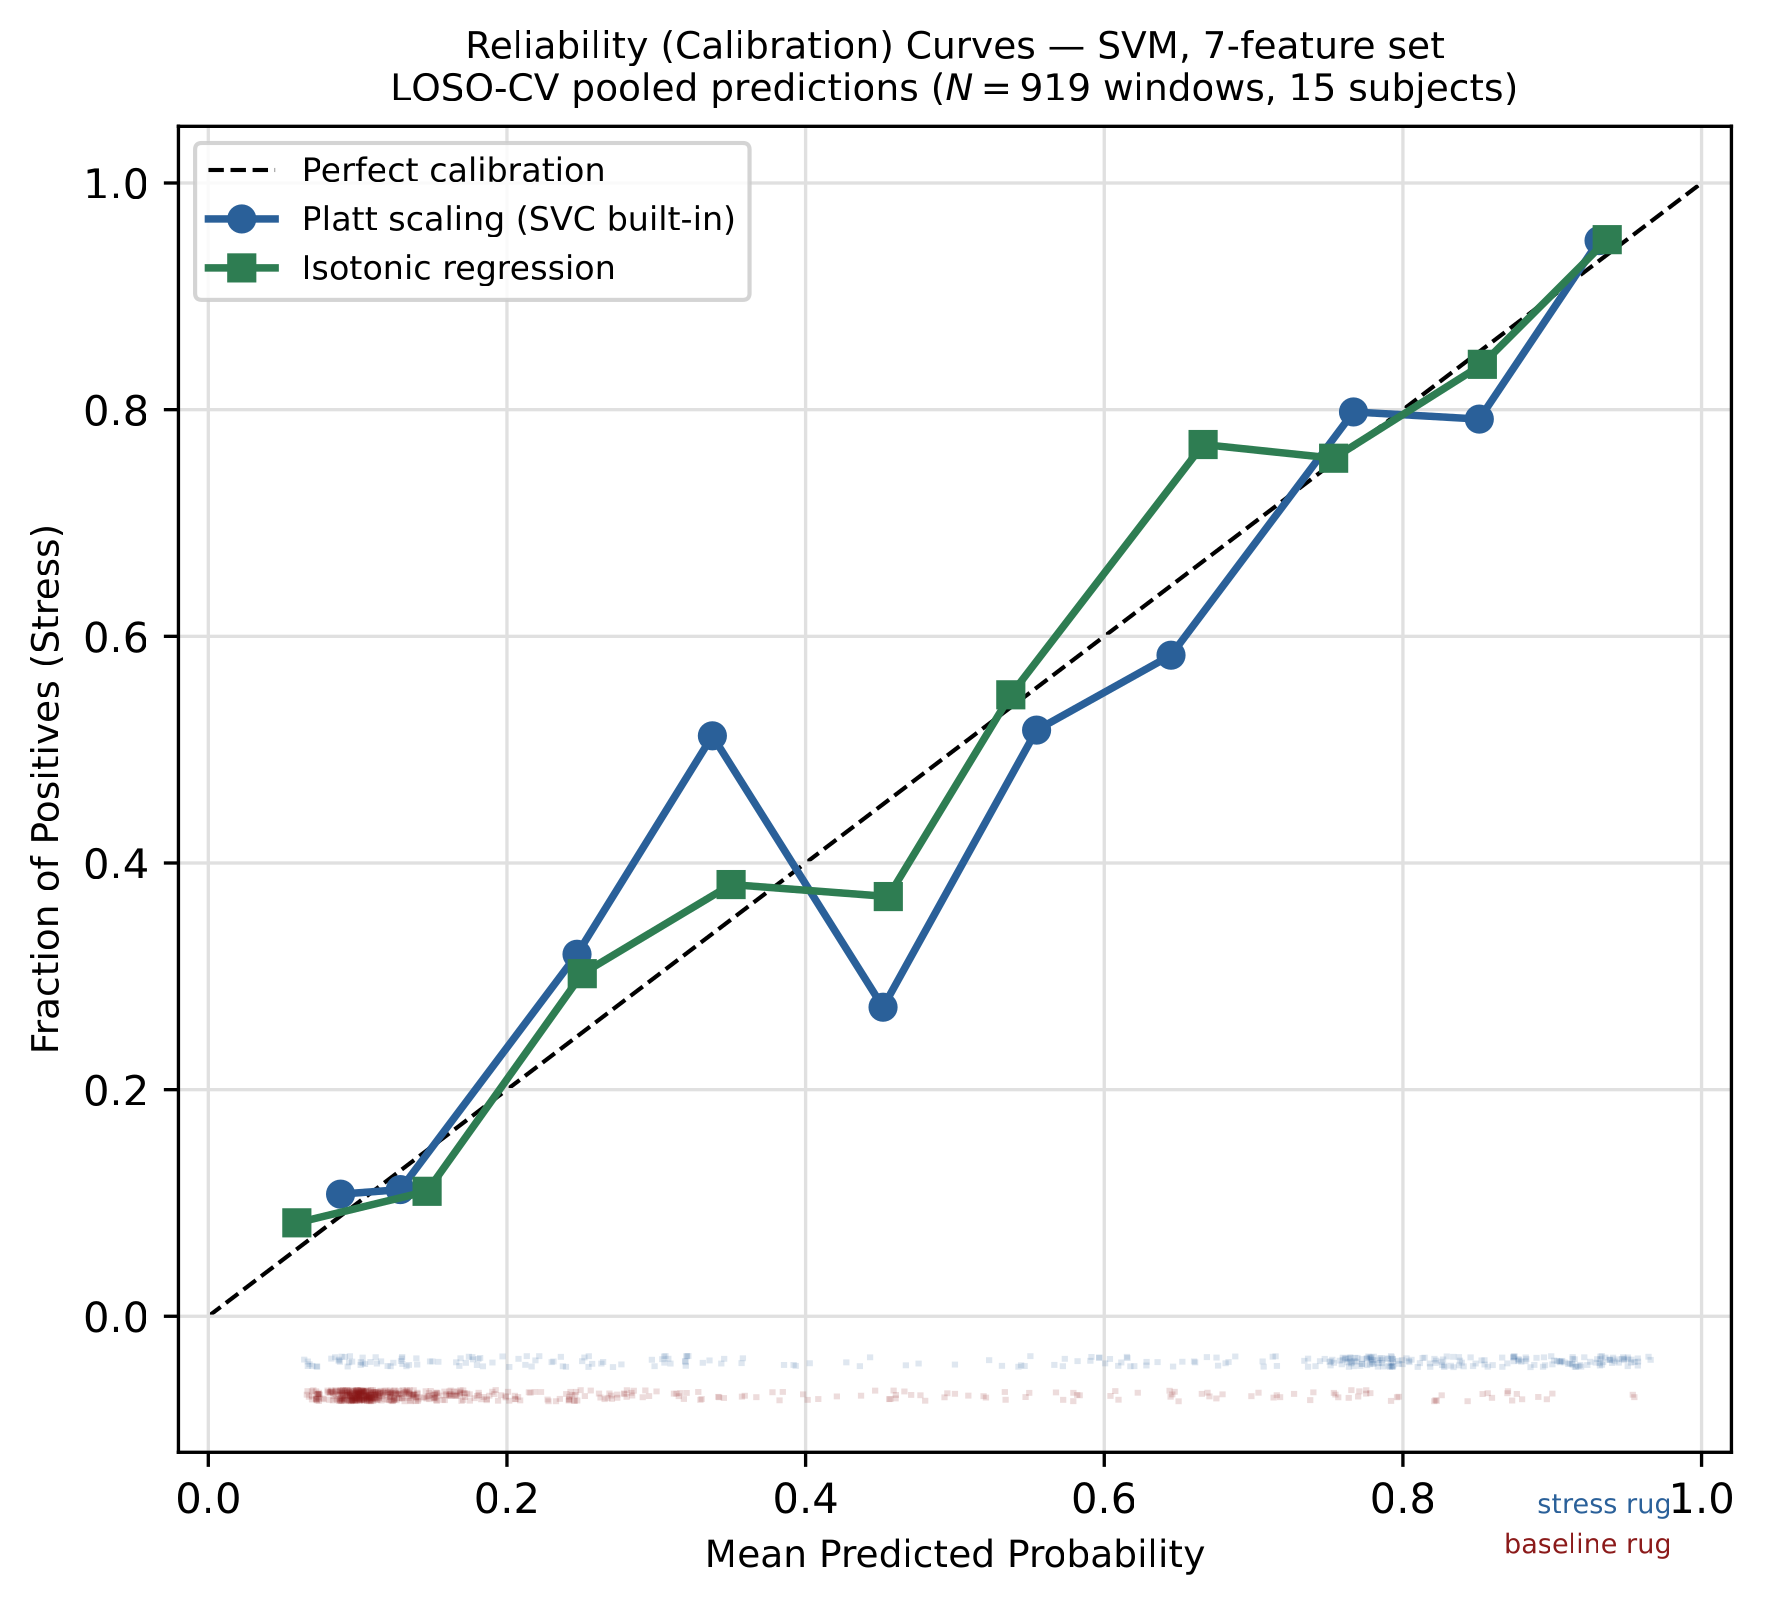
Probability calibration
Raw SVM probabilities already usable: Brier Skill Score 0.397; isotonic → 0.403 (negligible; a safety measure, not a skill gain).
Enables abstention: flag 0.4 < p̂ < 0.6 as "uncertain".
ARIMA cross-check
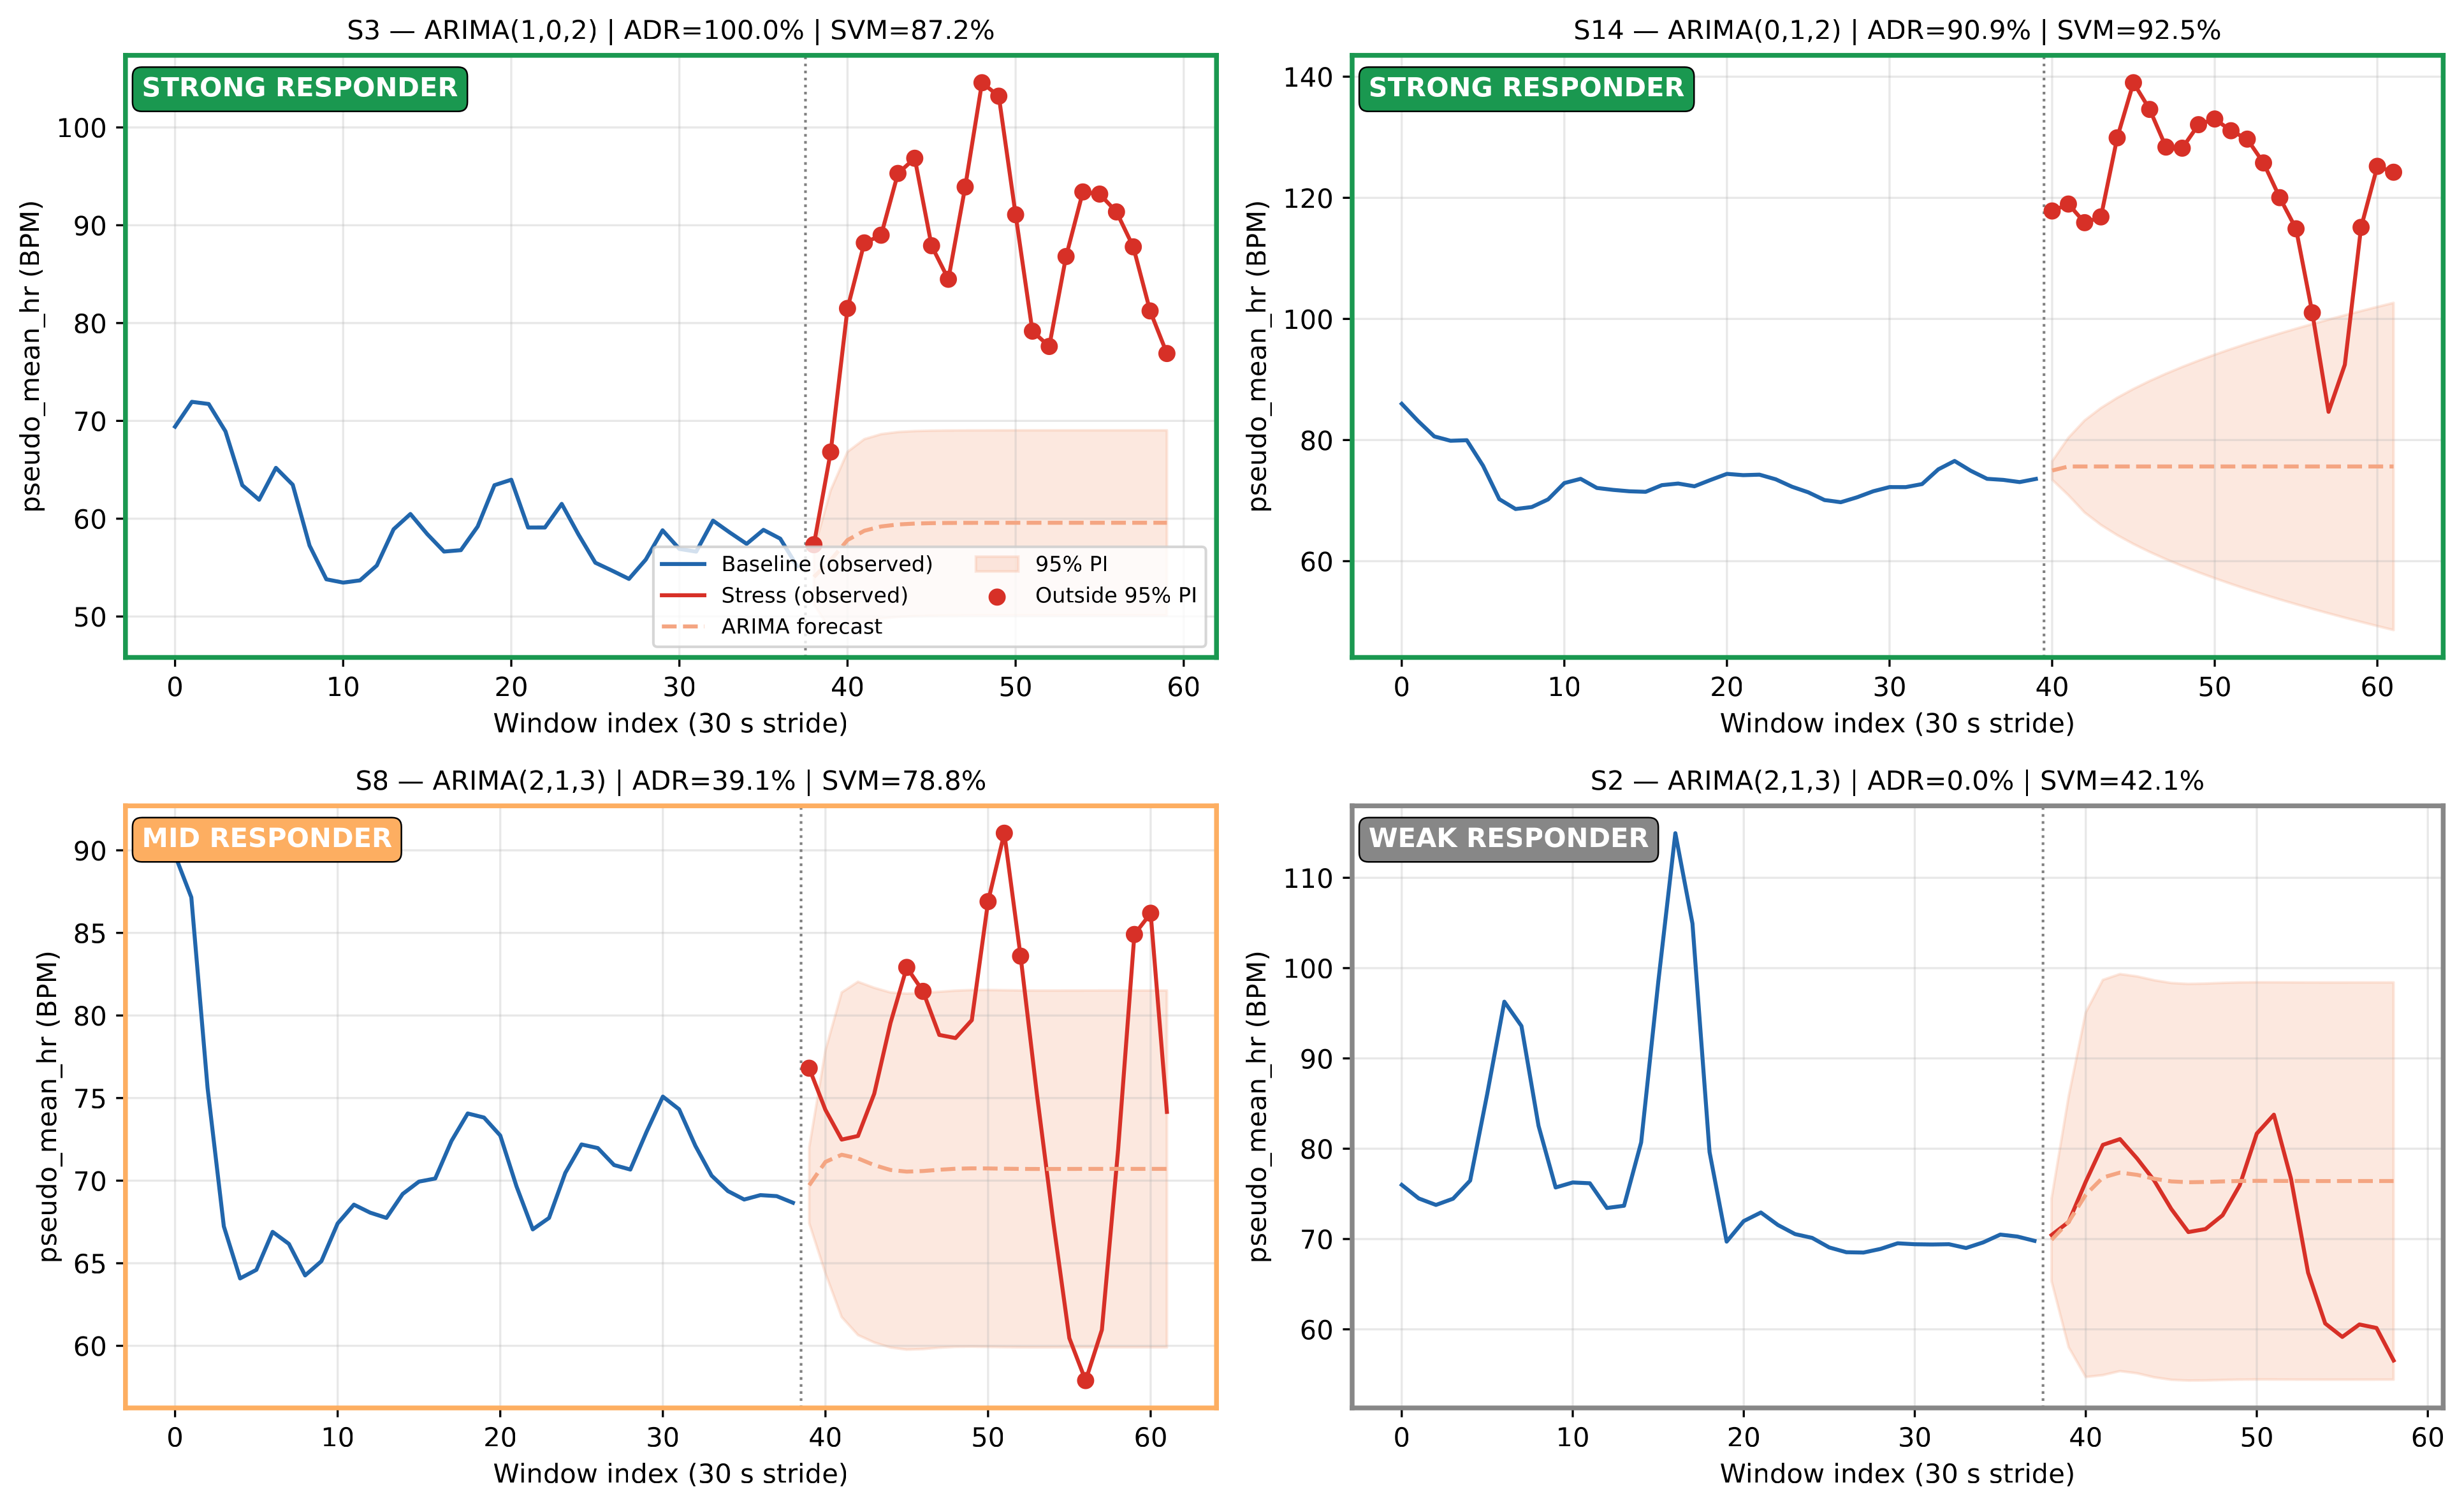
Forecast each subject's baseline HR into stress; count windows outside 95% PI → anomaly detection rate (ADR).
Per-subject ADR vs SVM accuracy: r = 0.742.
| Responder type | ADR | SVM acc. |
|---|---|---|
| Strong | > 50% | 87.9% |
| Weak | ≤ 10% | 52.2% |
A 35.7 pp gap: a confidence signal derivable from baseline HR alone. N=15, 95% CI [0.37, 0.91]; internal consistency check, not independent validation.
How is ADR computed?
Per subject: fit ARIMA on baseline HR, forecast into stress period, count 60-s windows whose mean HR falls outside the 95% prediction interval → ADR.
Also a directionality finding: HR stabilises against anticipatory drift once stress begins.
Proposed confidence gate
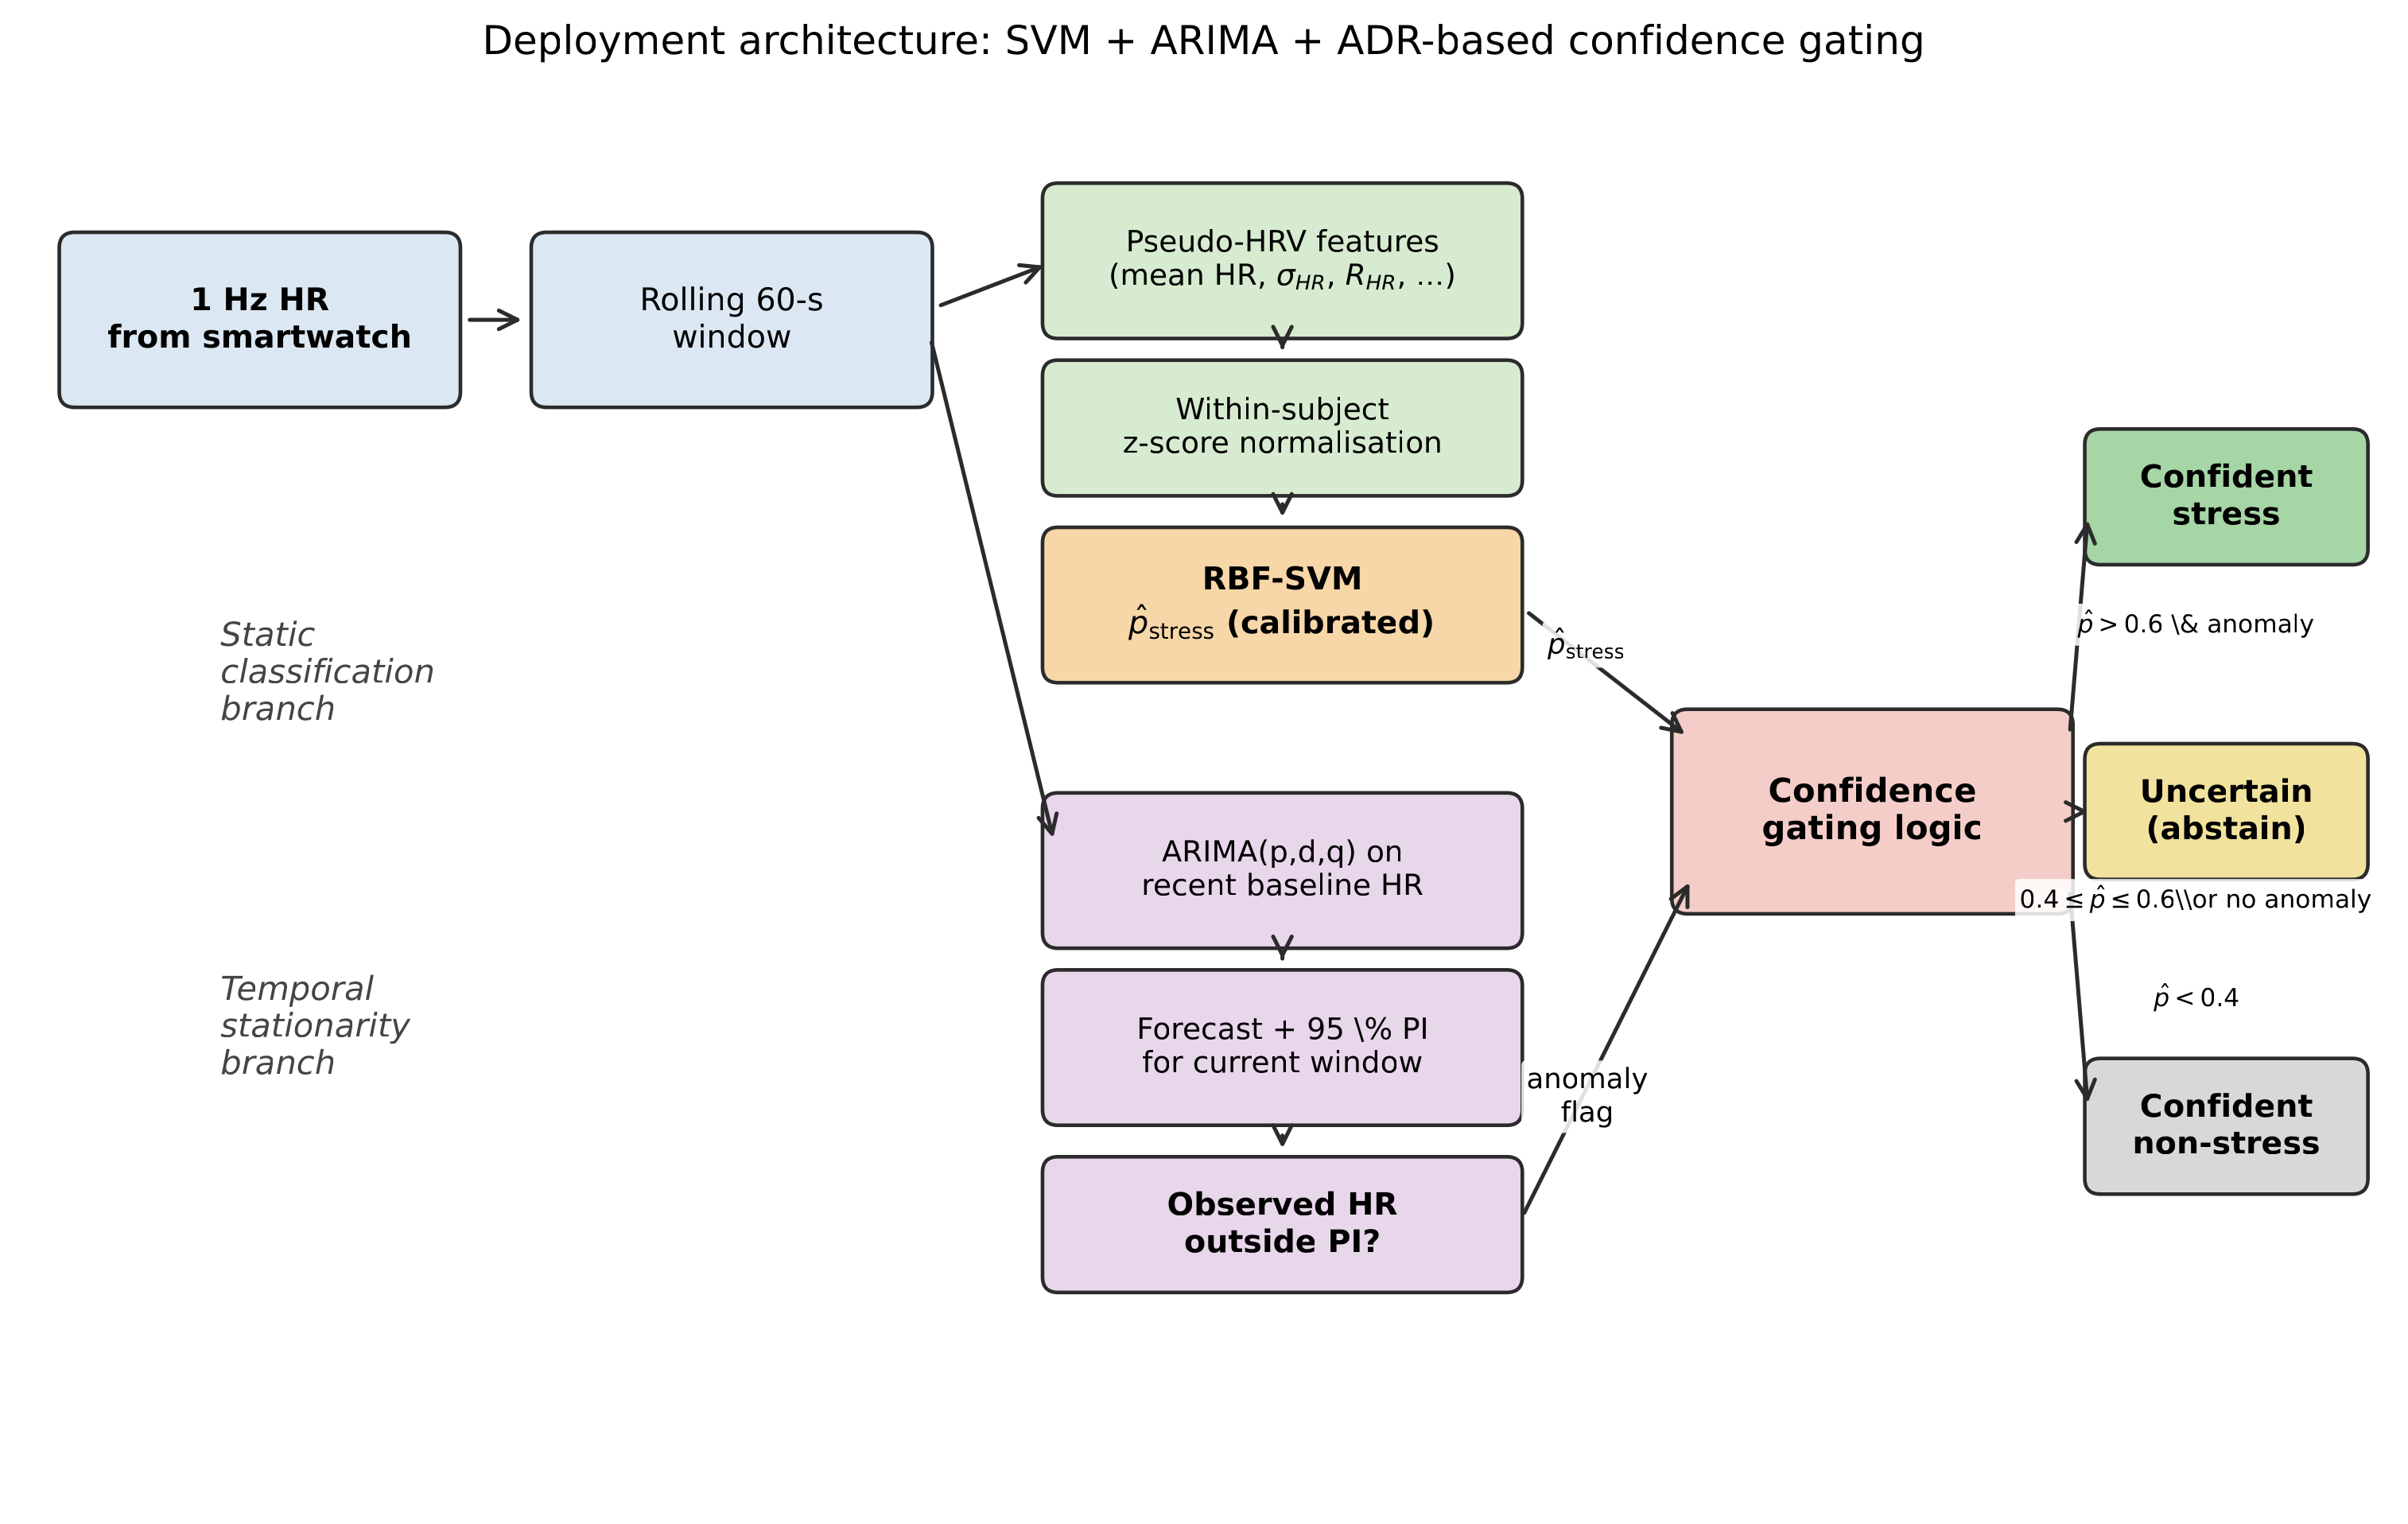
Two branches over the same 1 Hz HR stream:
- calibrated stress probability from the classifier;
- baseline ARIMA anomaly flag from the 95% prediction interval.
This is a deployment proposal motivated by WESAD, not an on-device validated feature.
Engineering contribution
System: platform, pipeline
Beyond the lab: enables scalable, remote stress-induction without laboratory infrastructure.
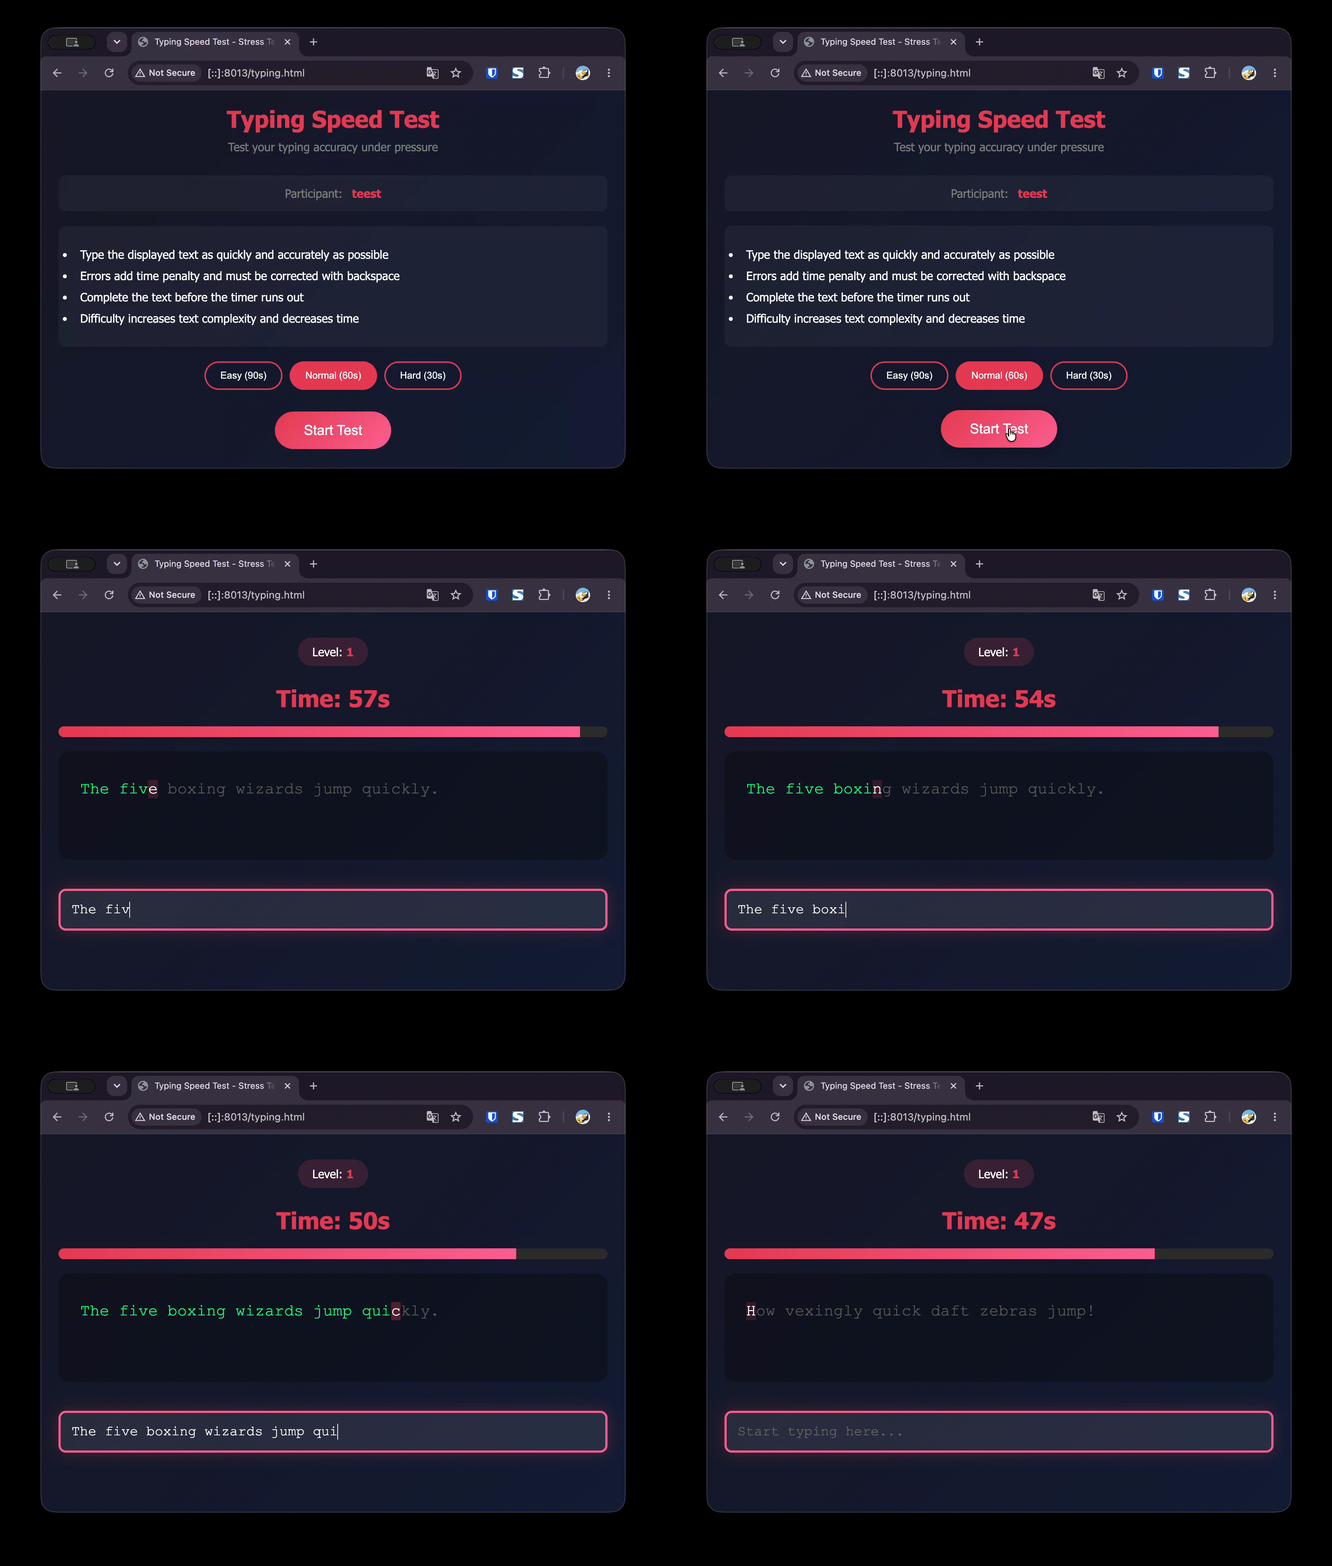
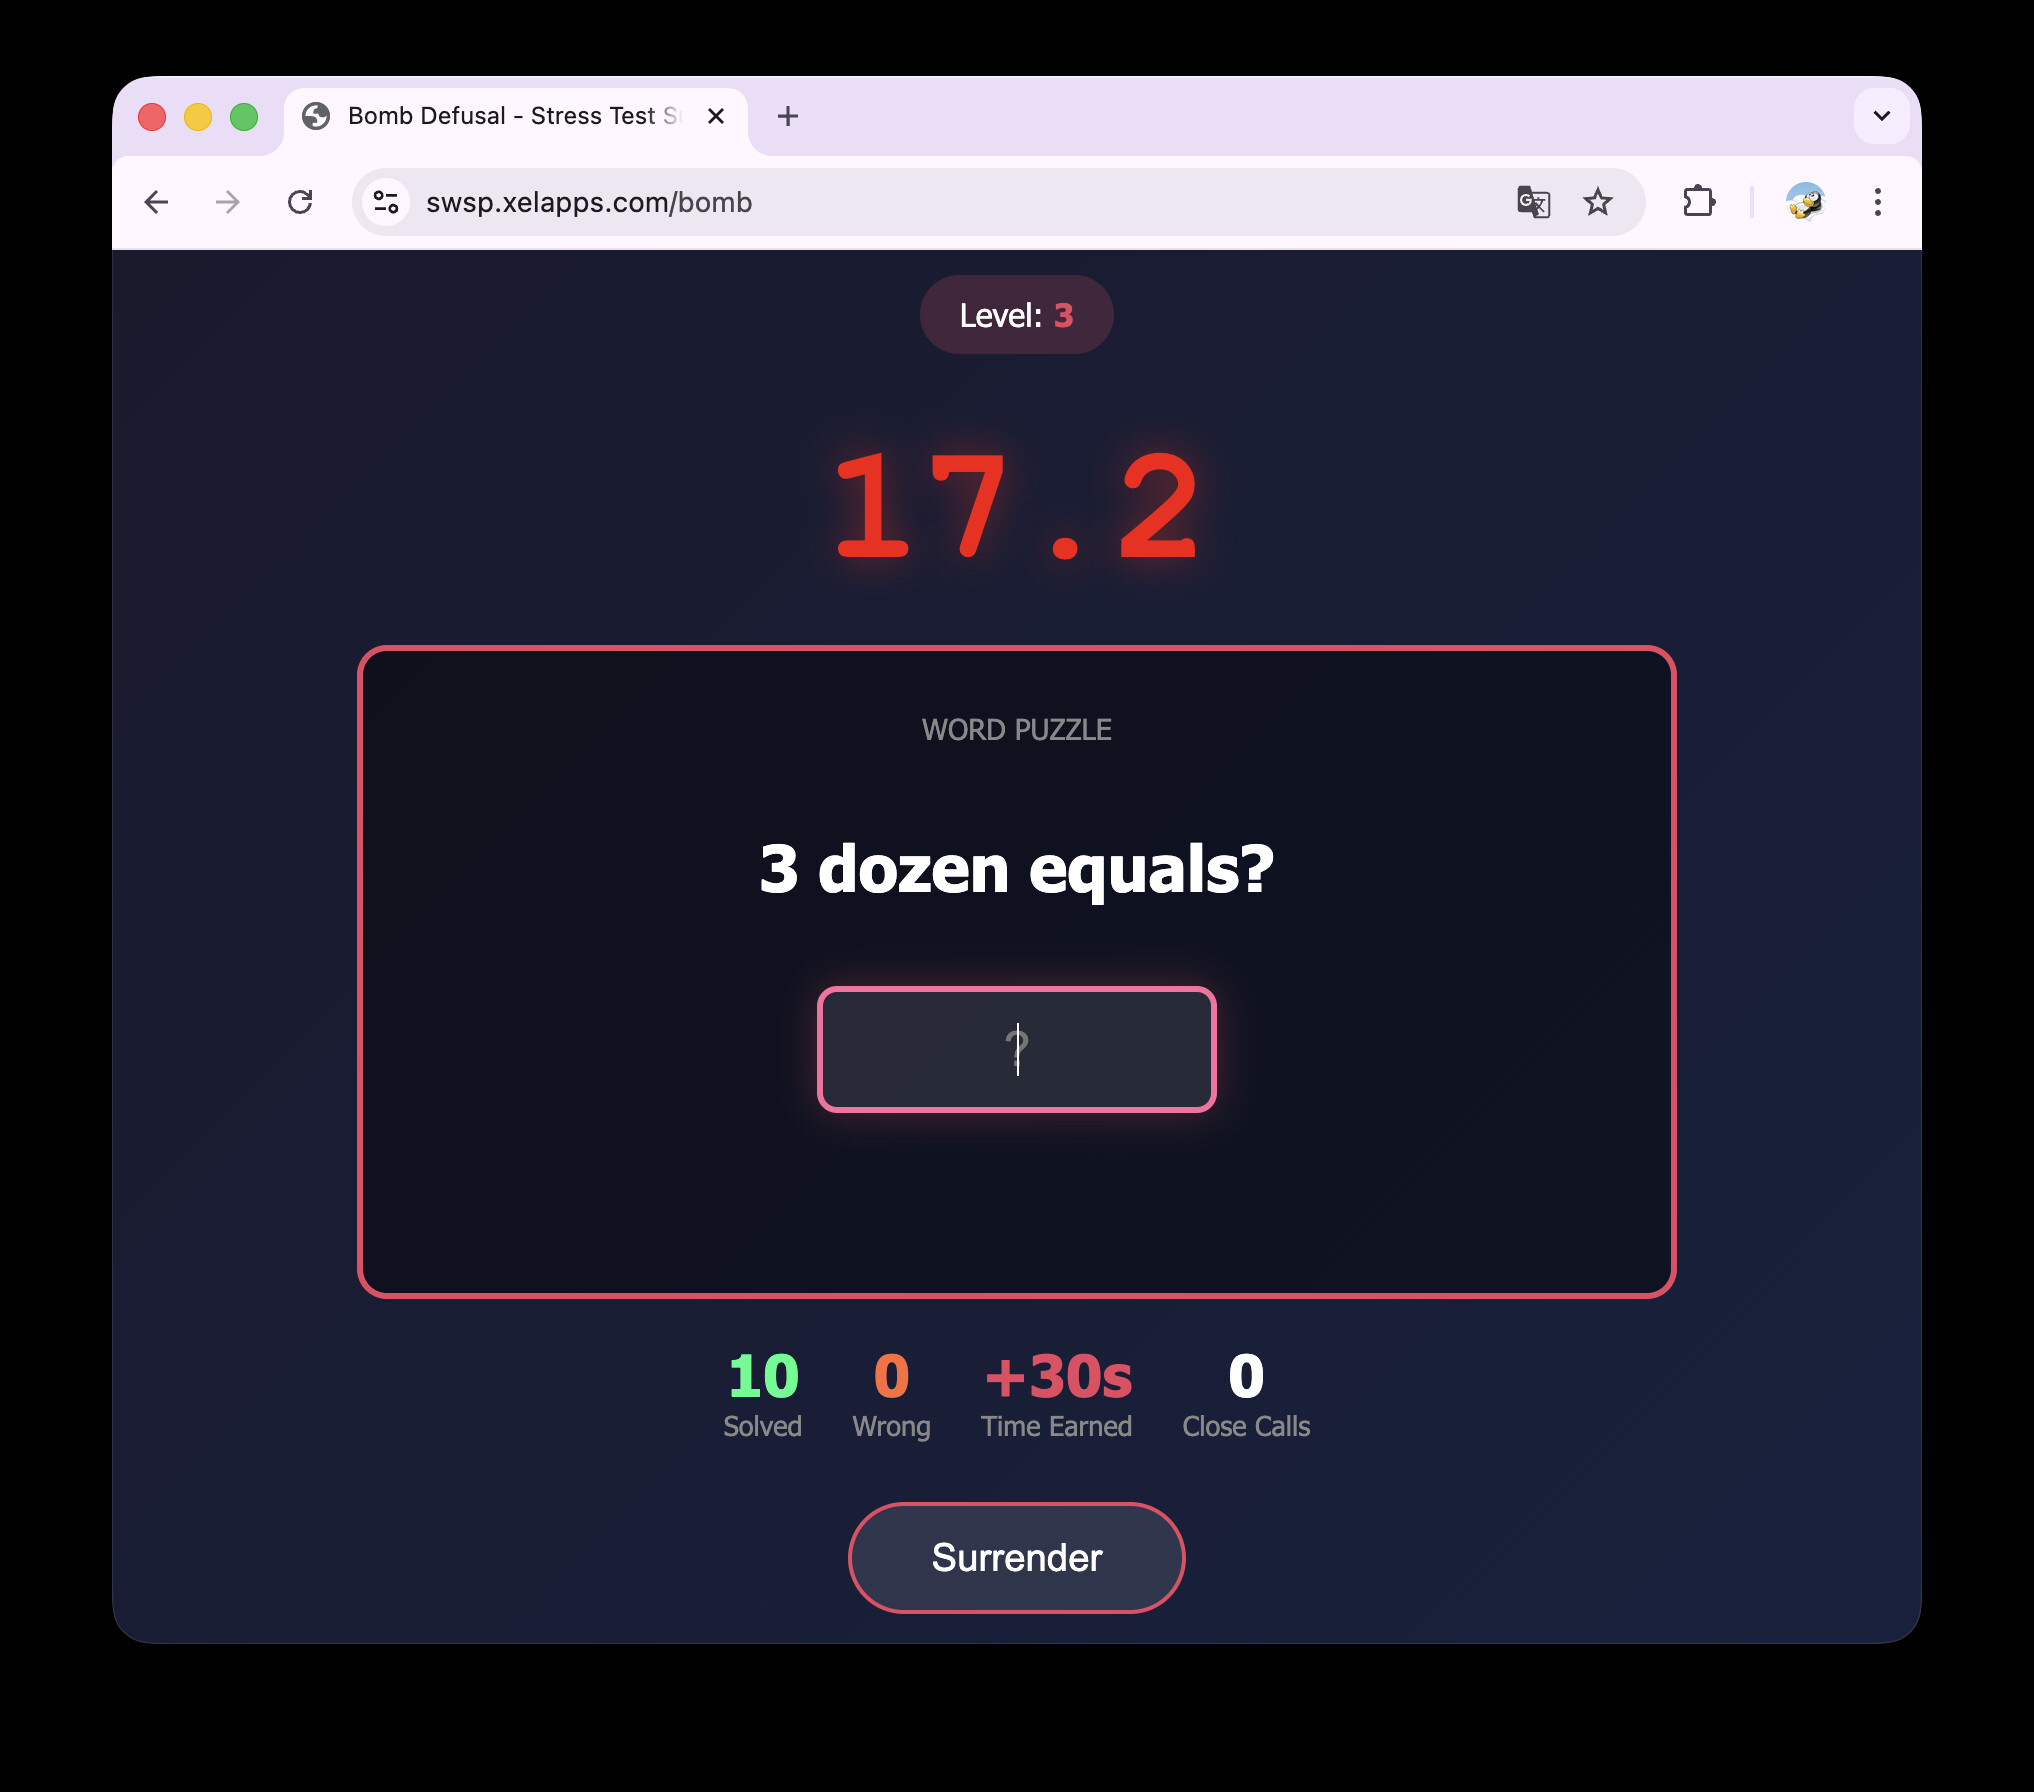
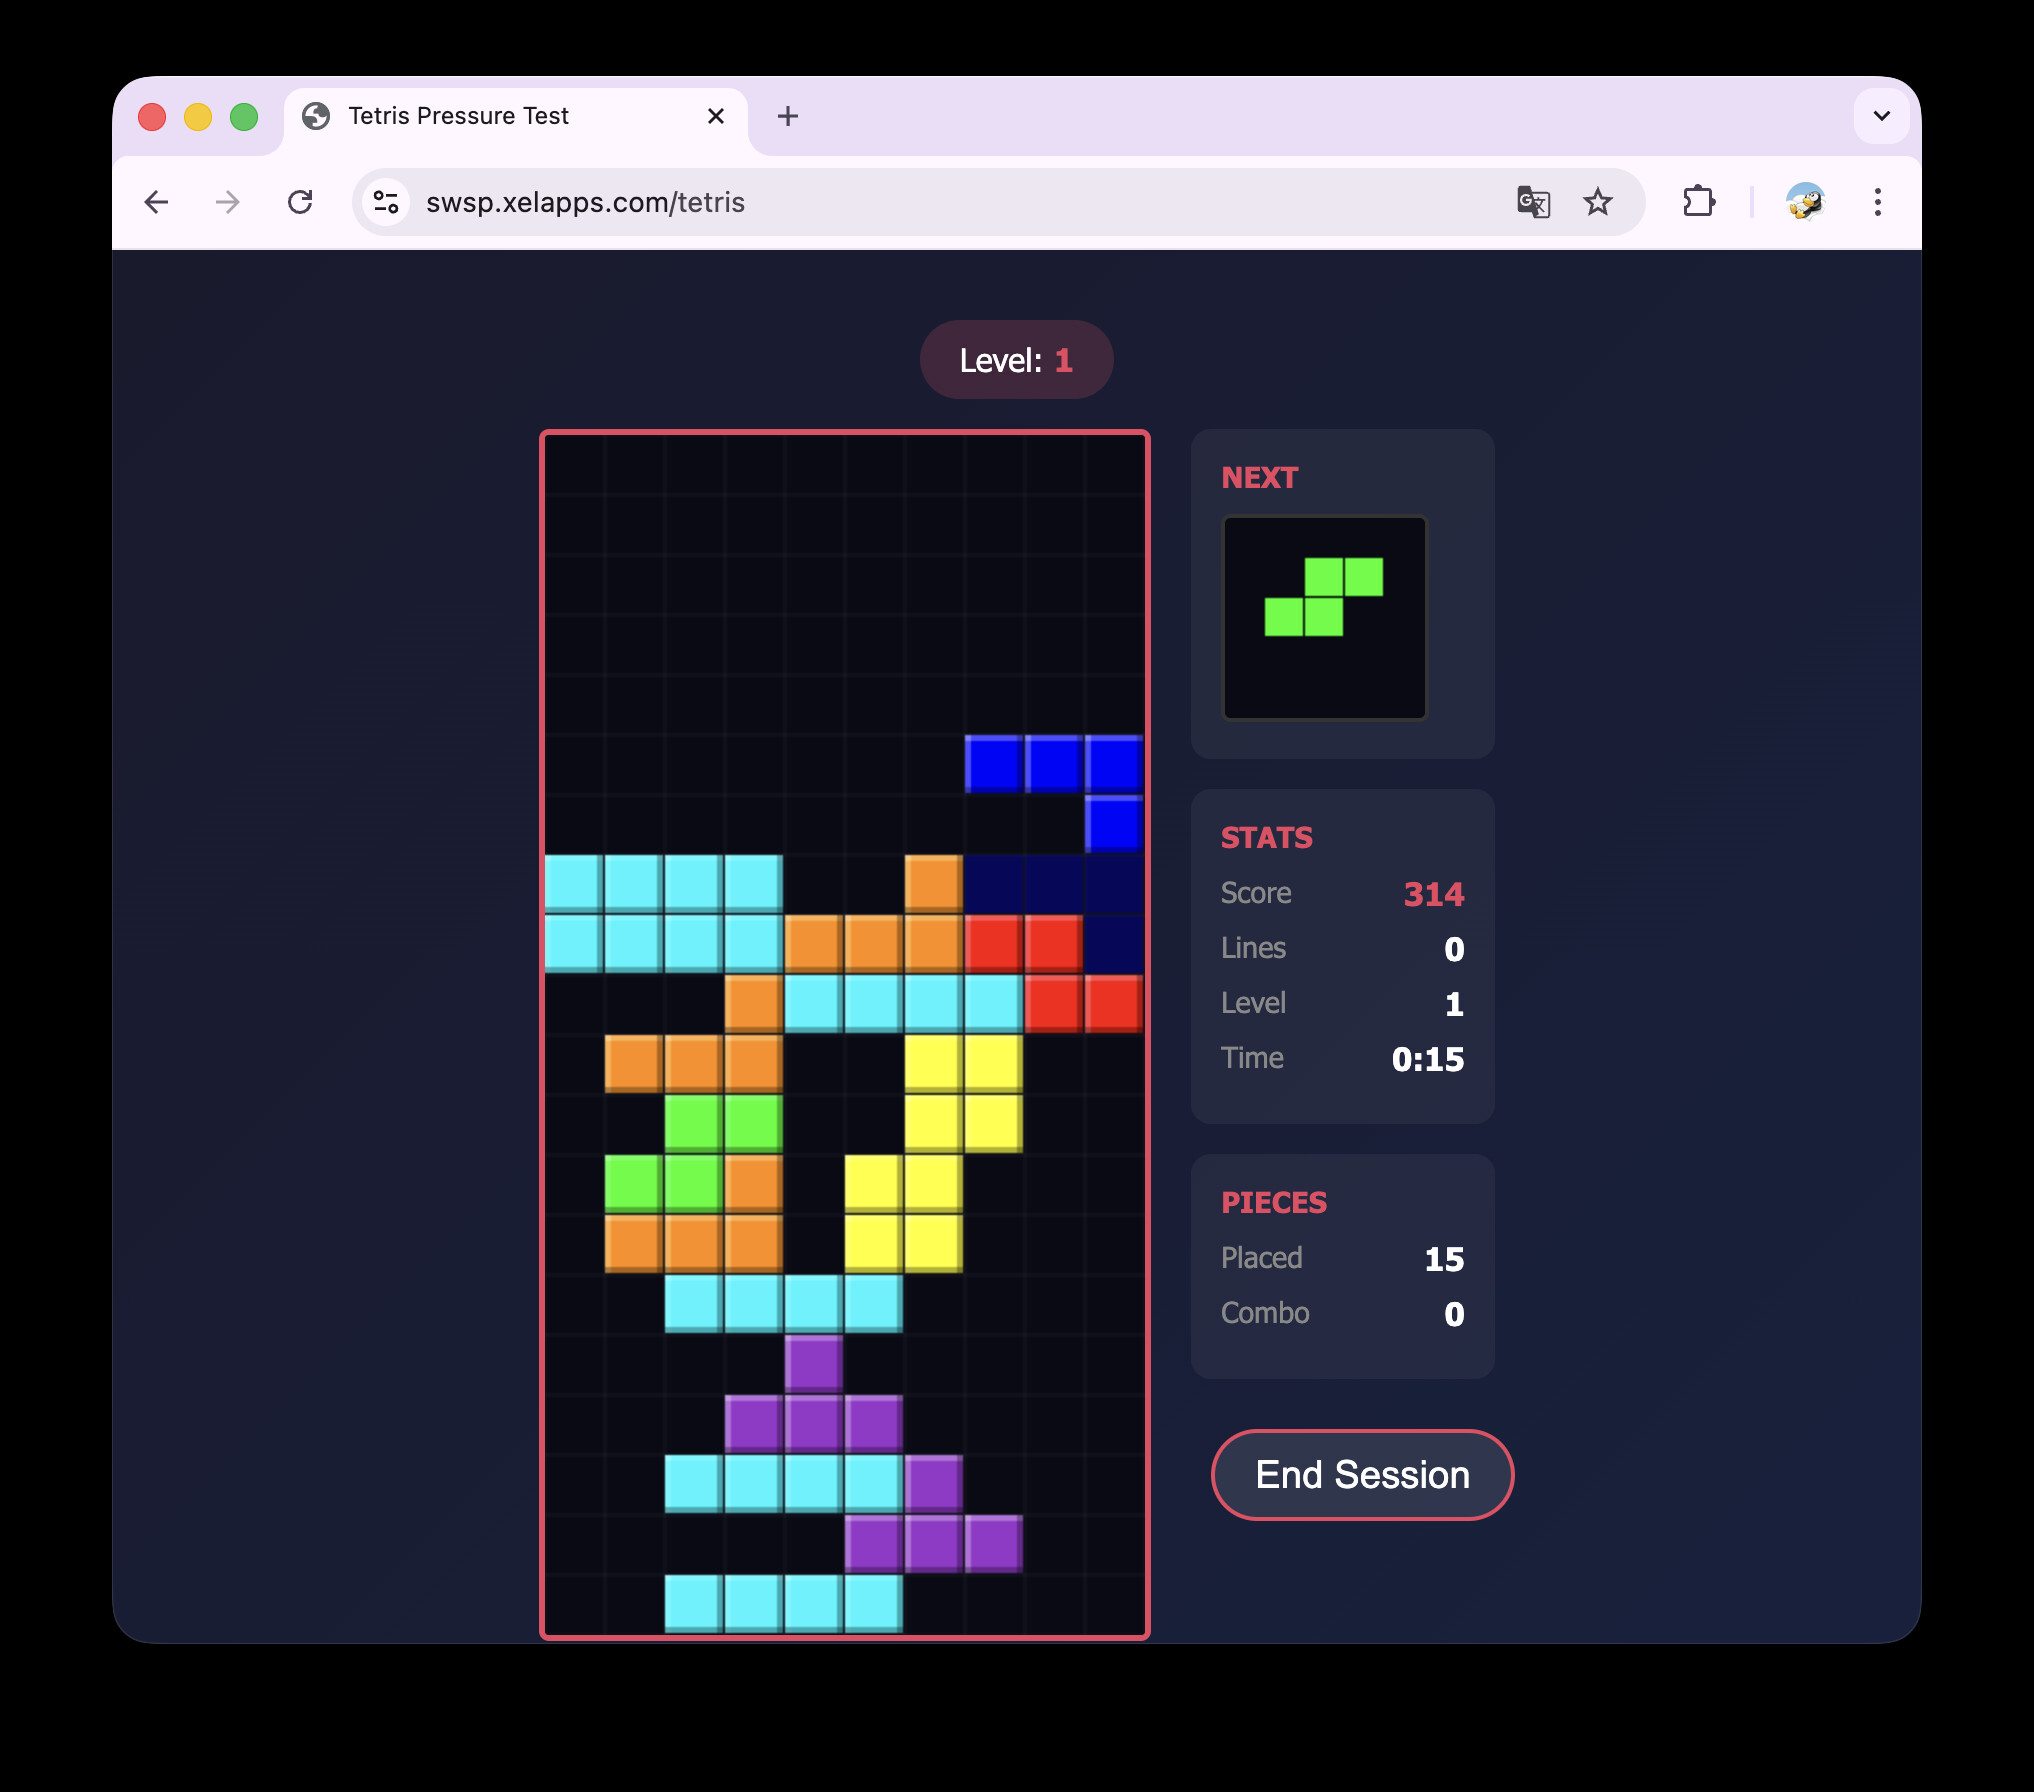
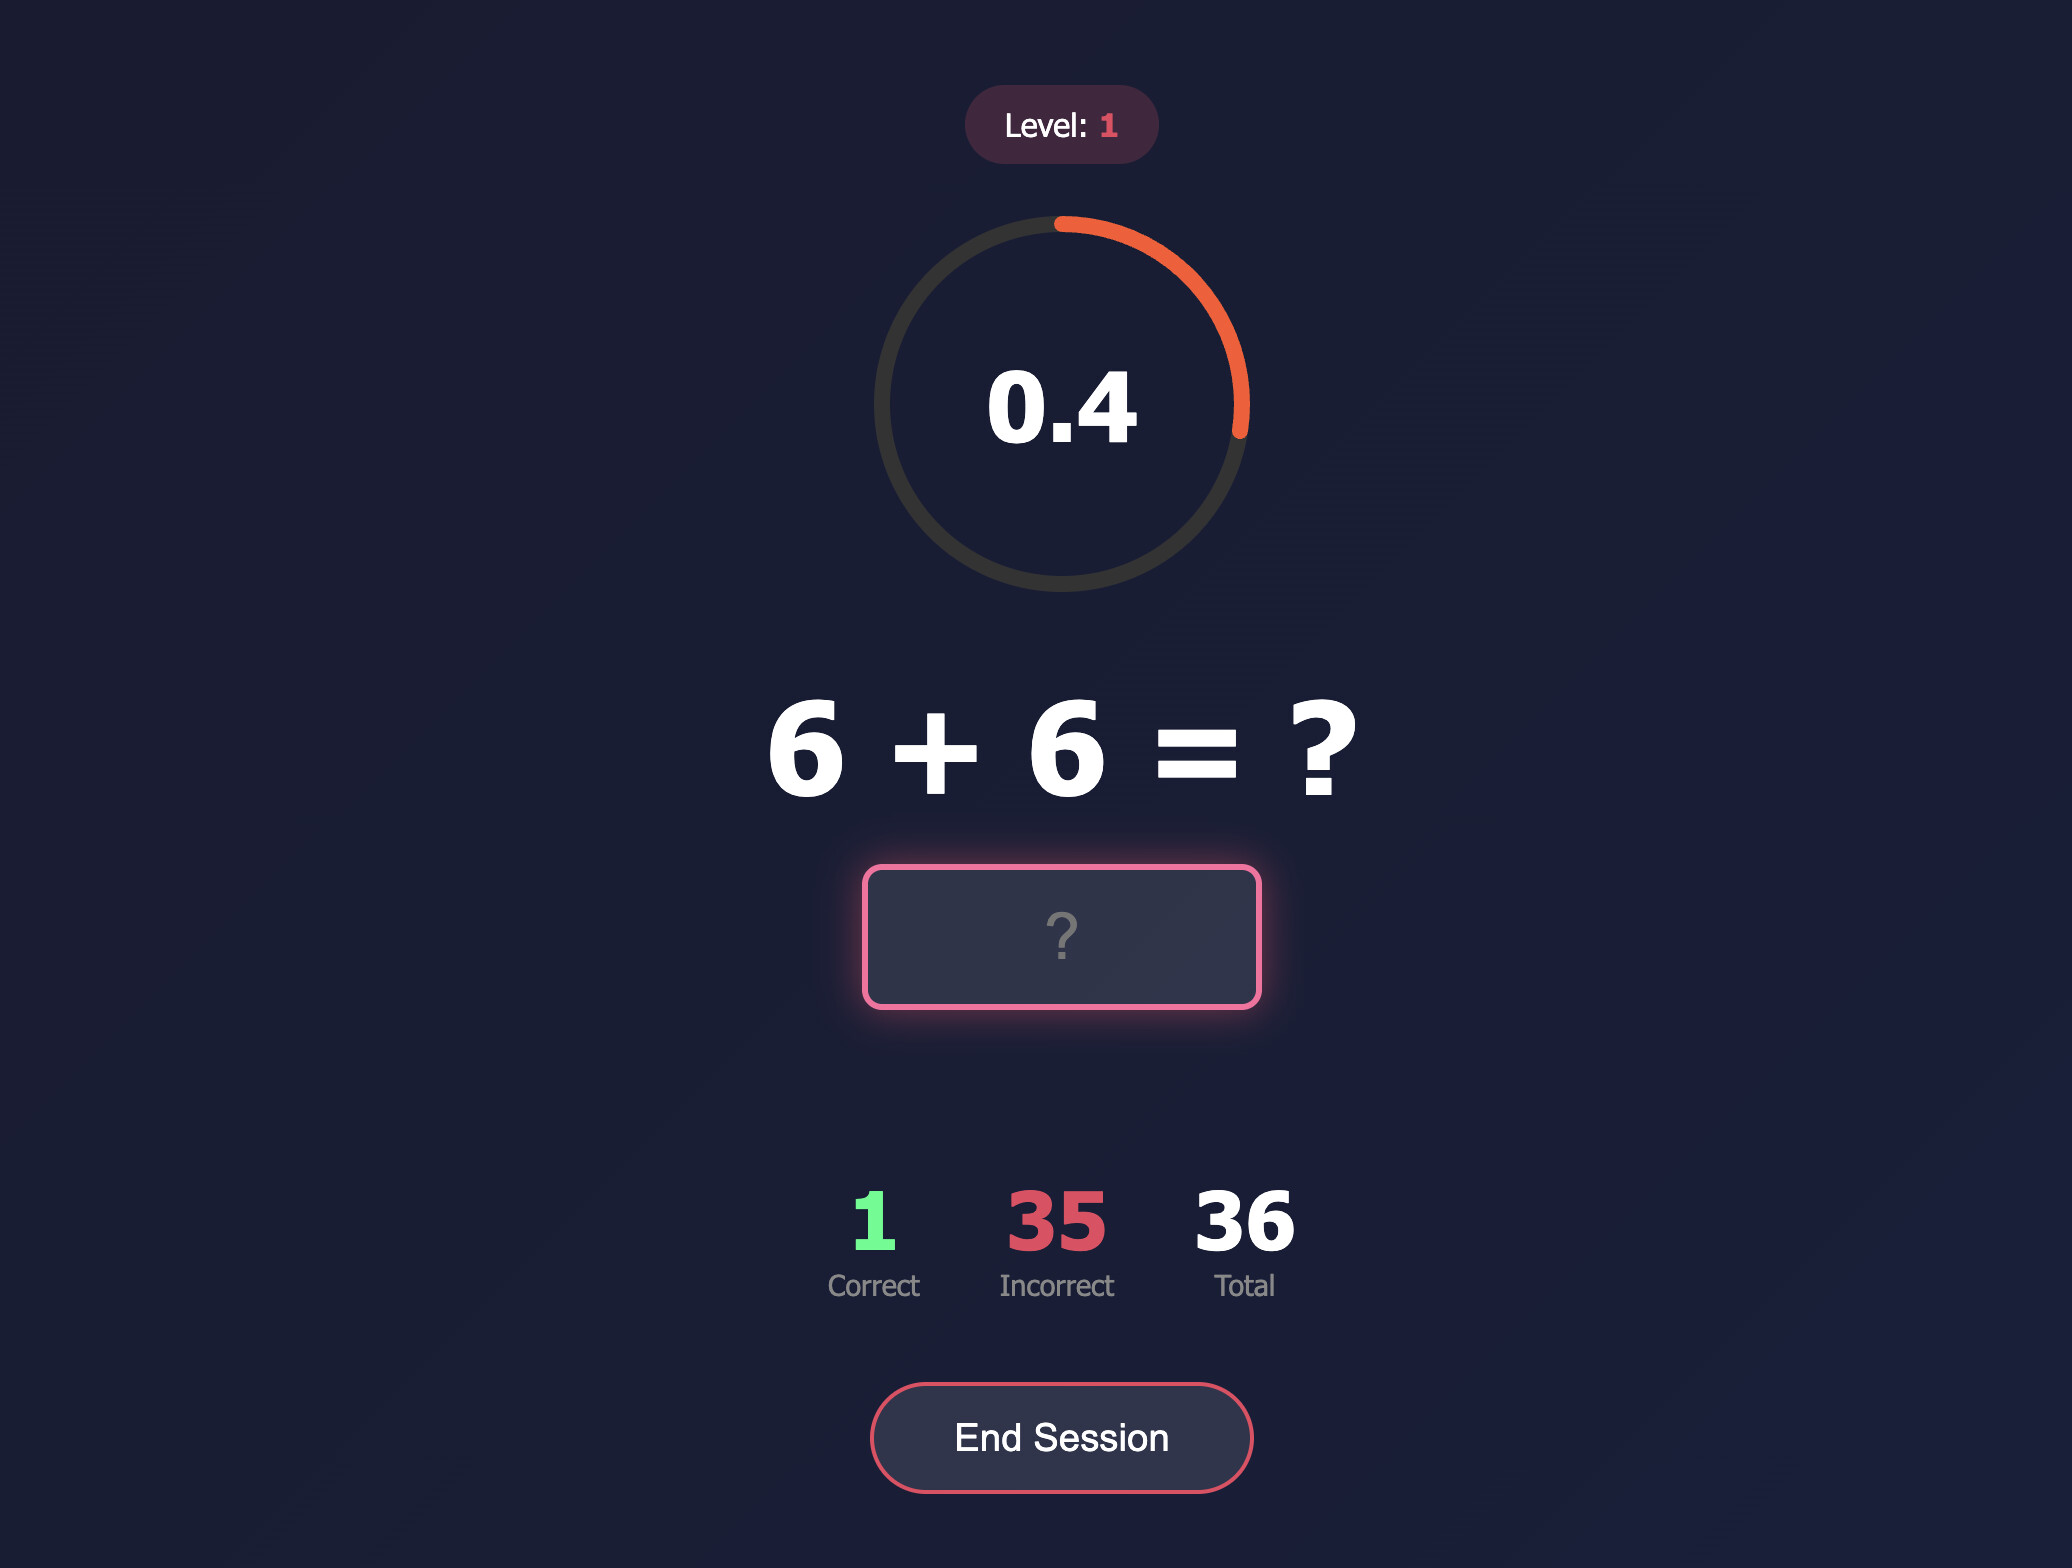
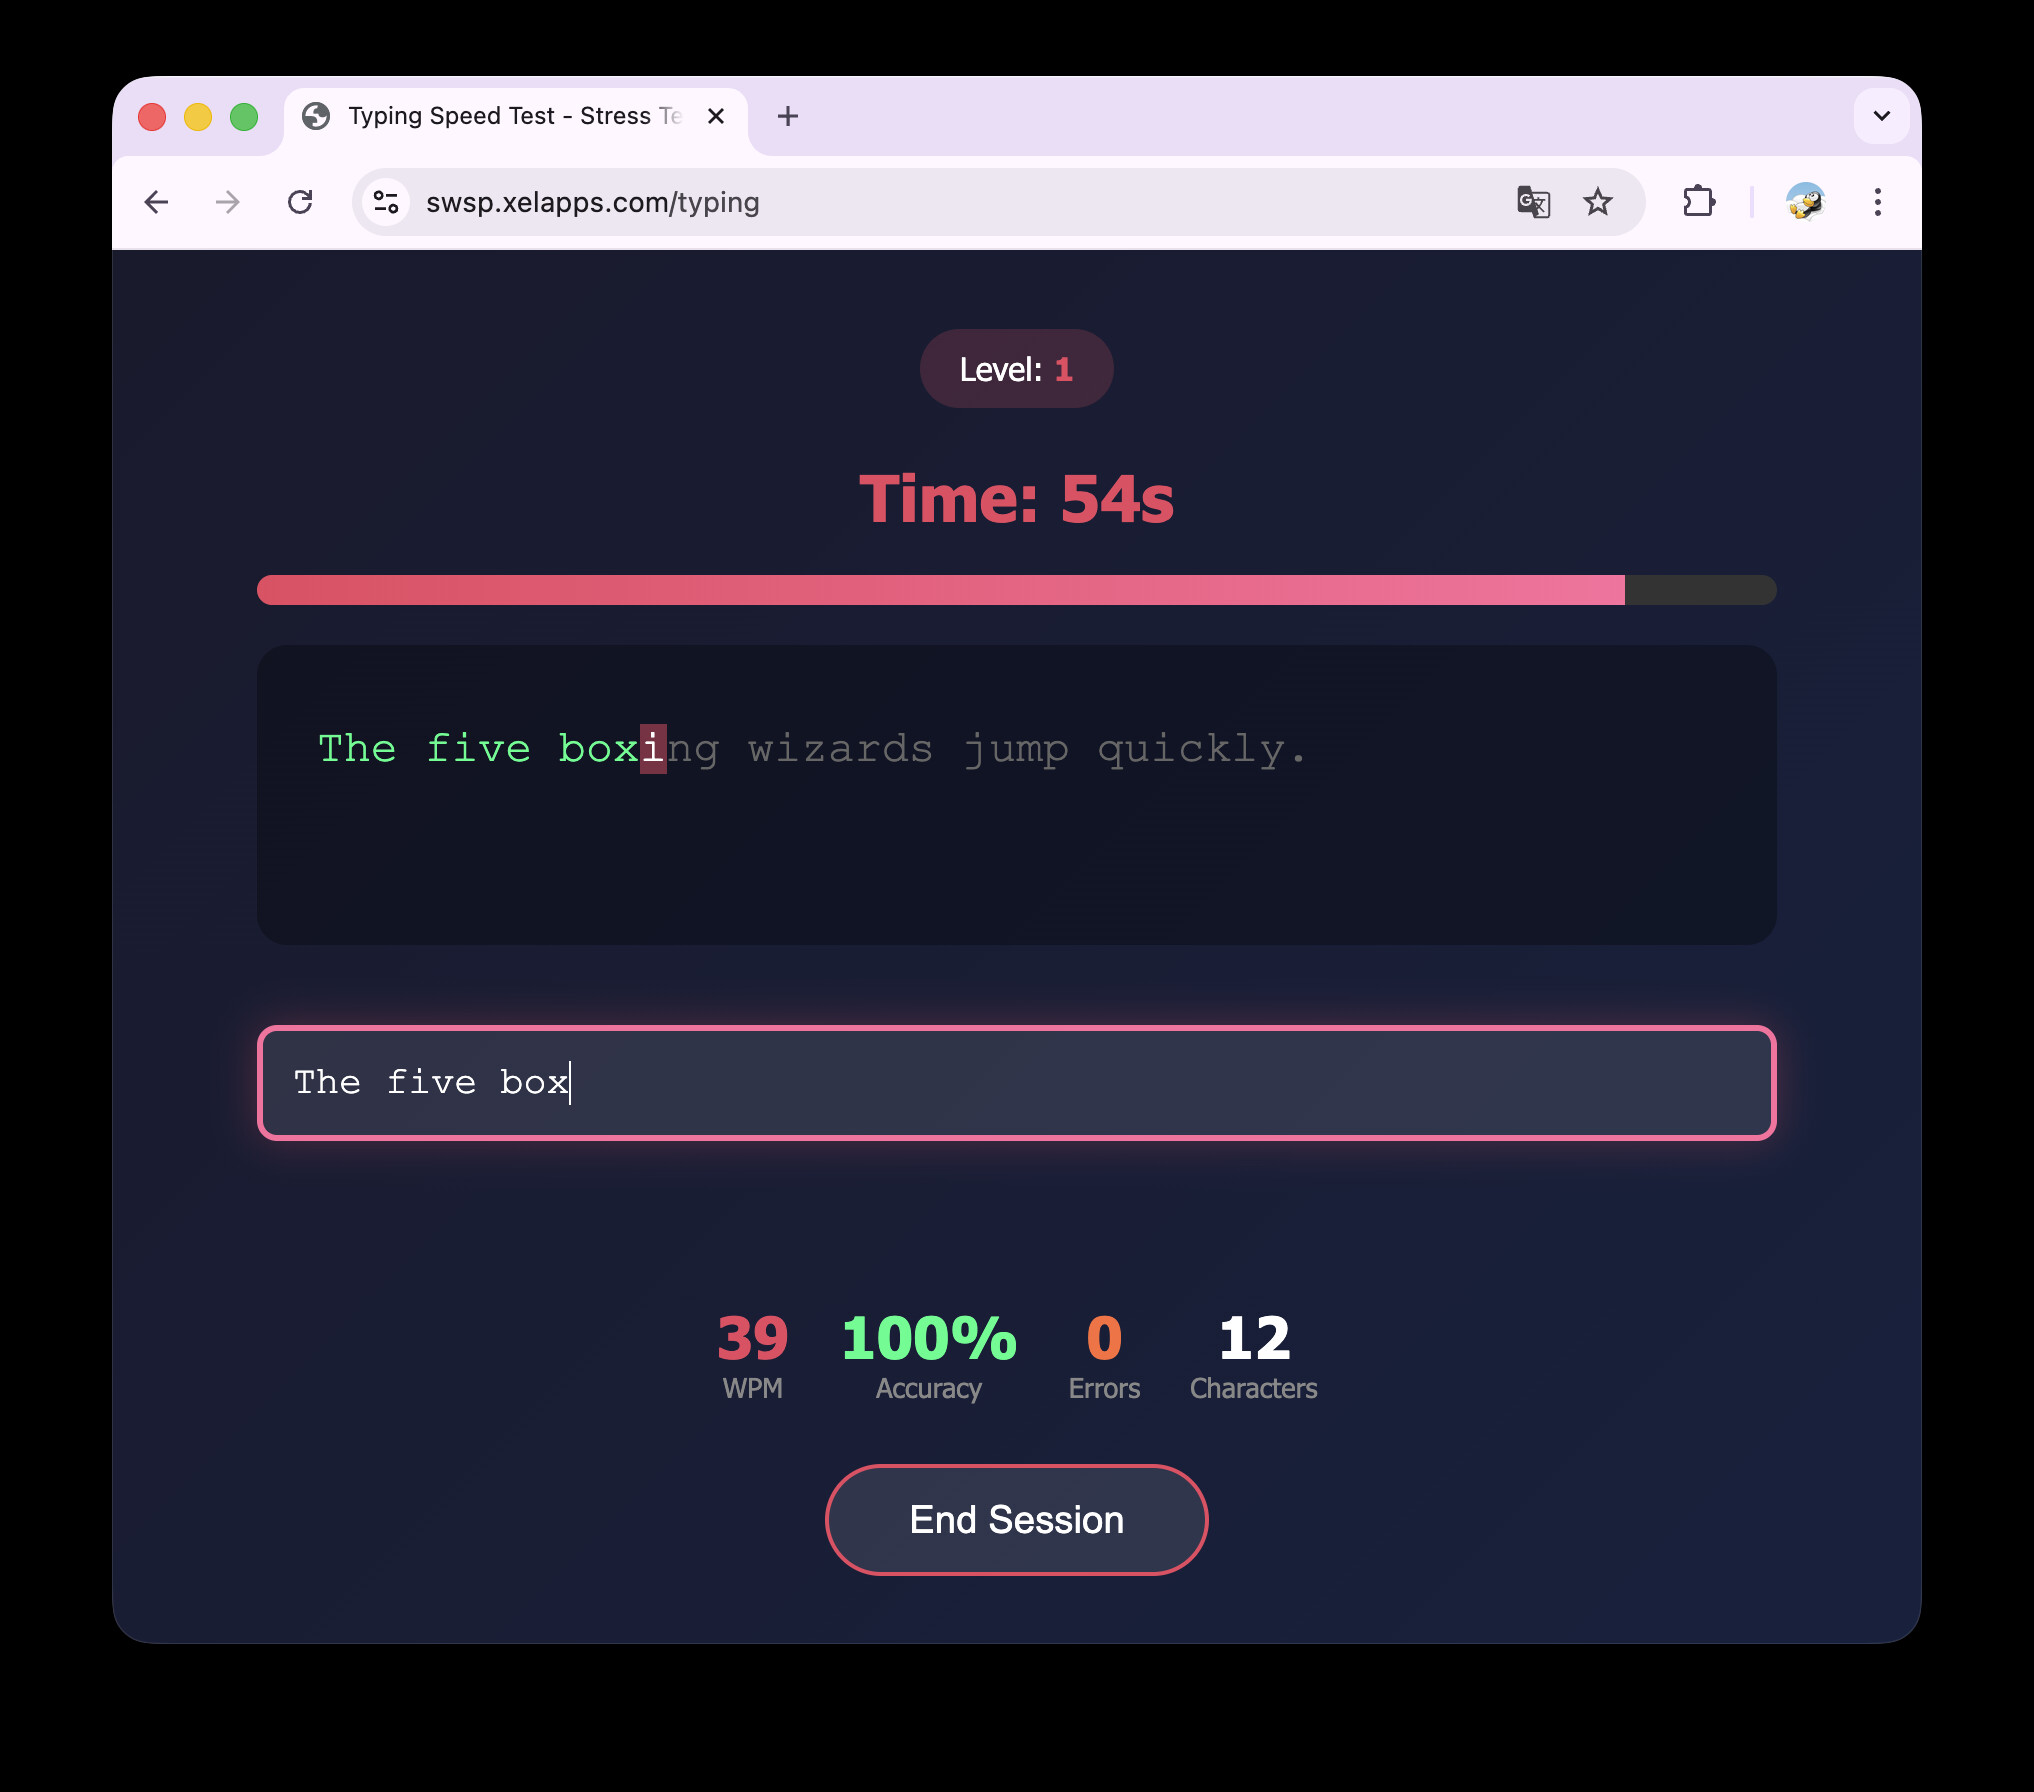
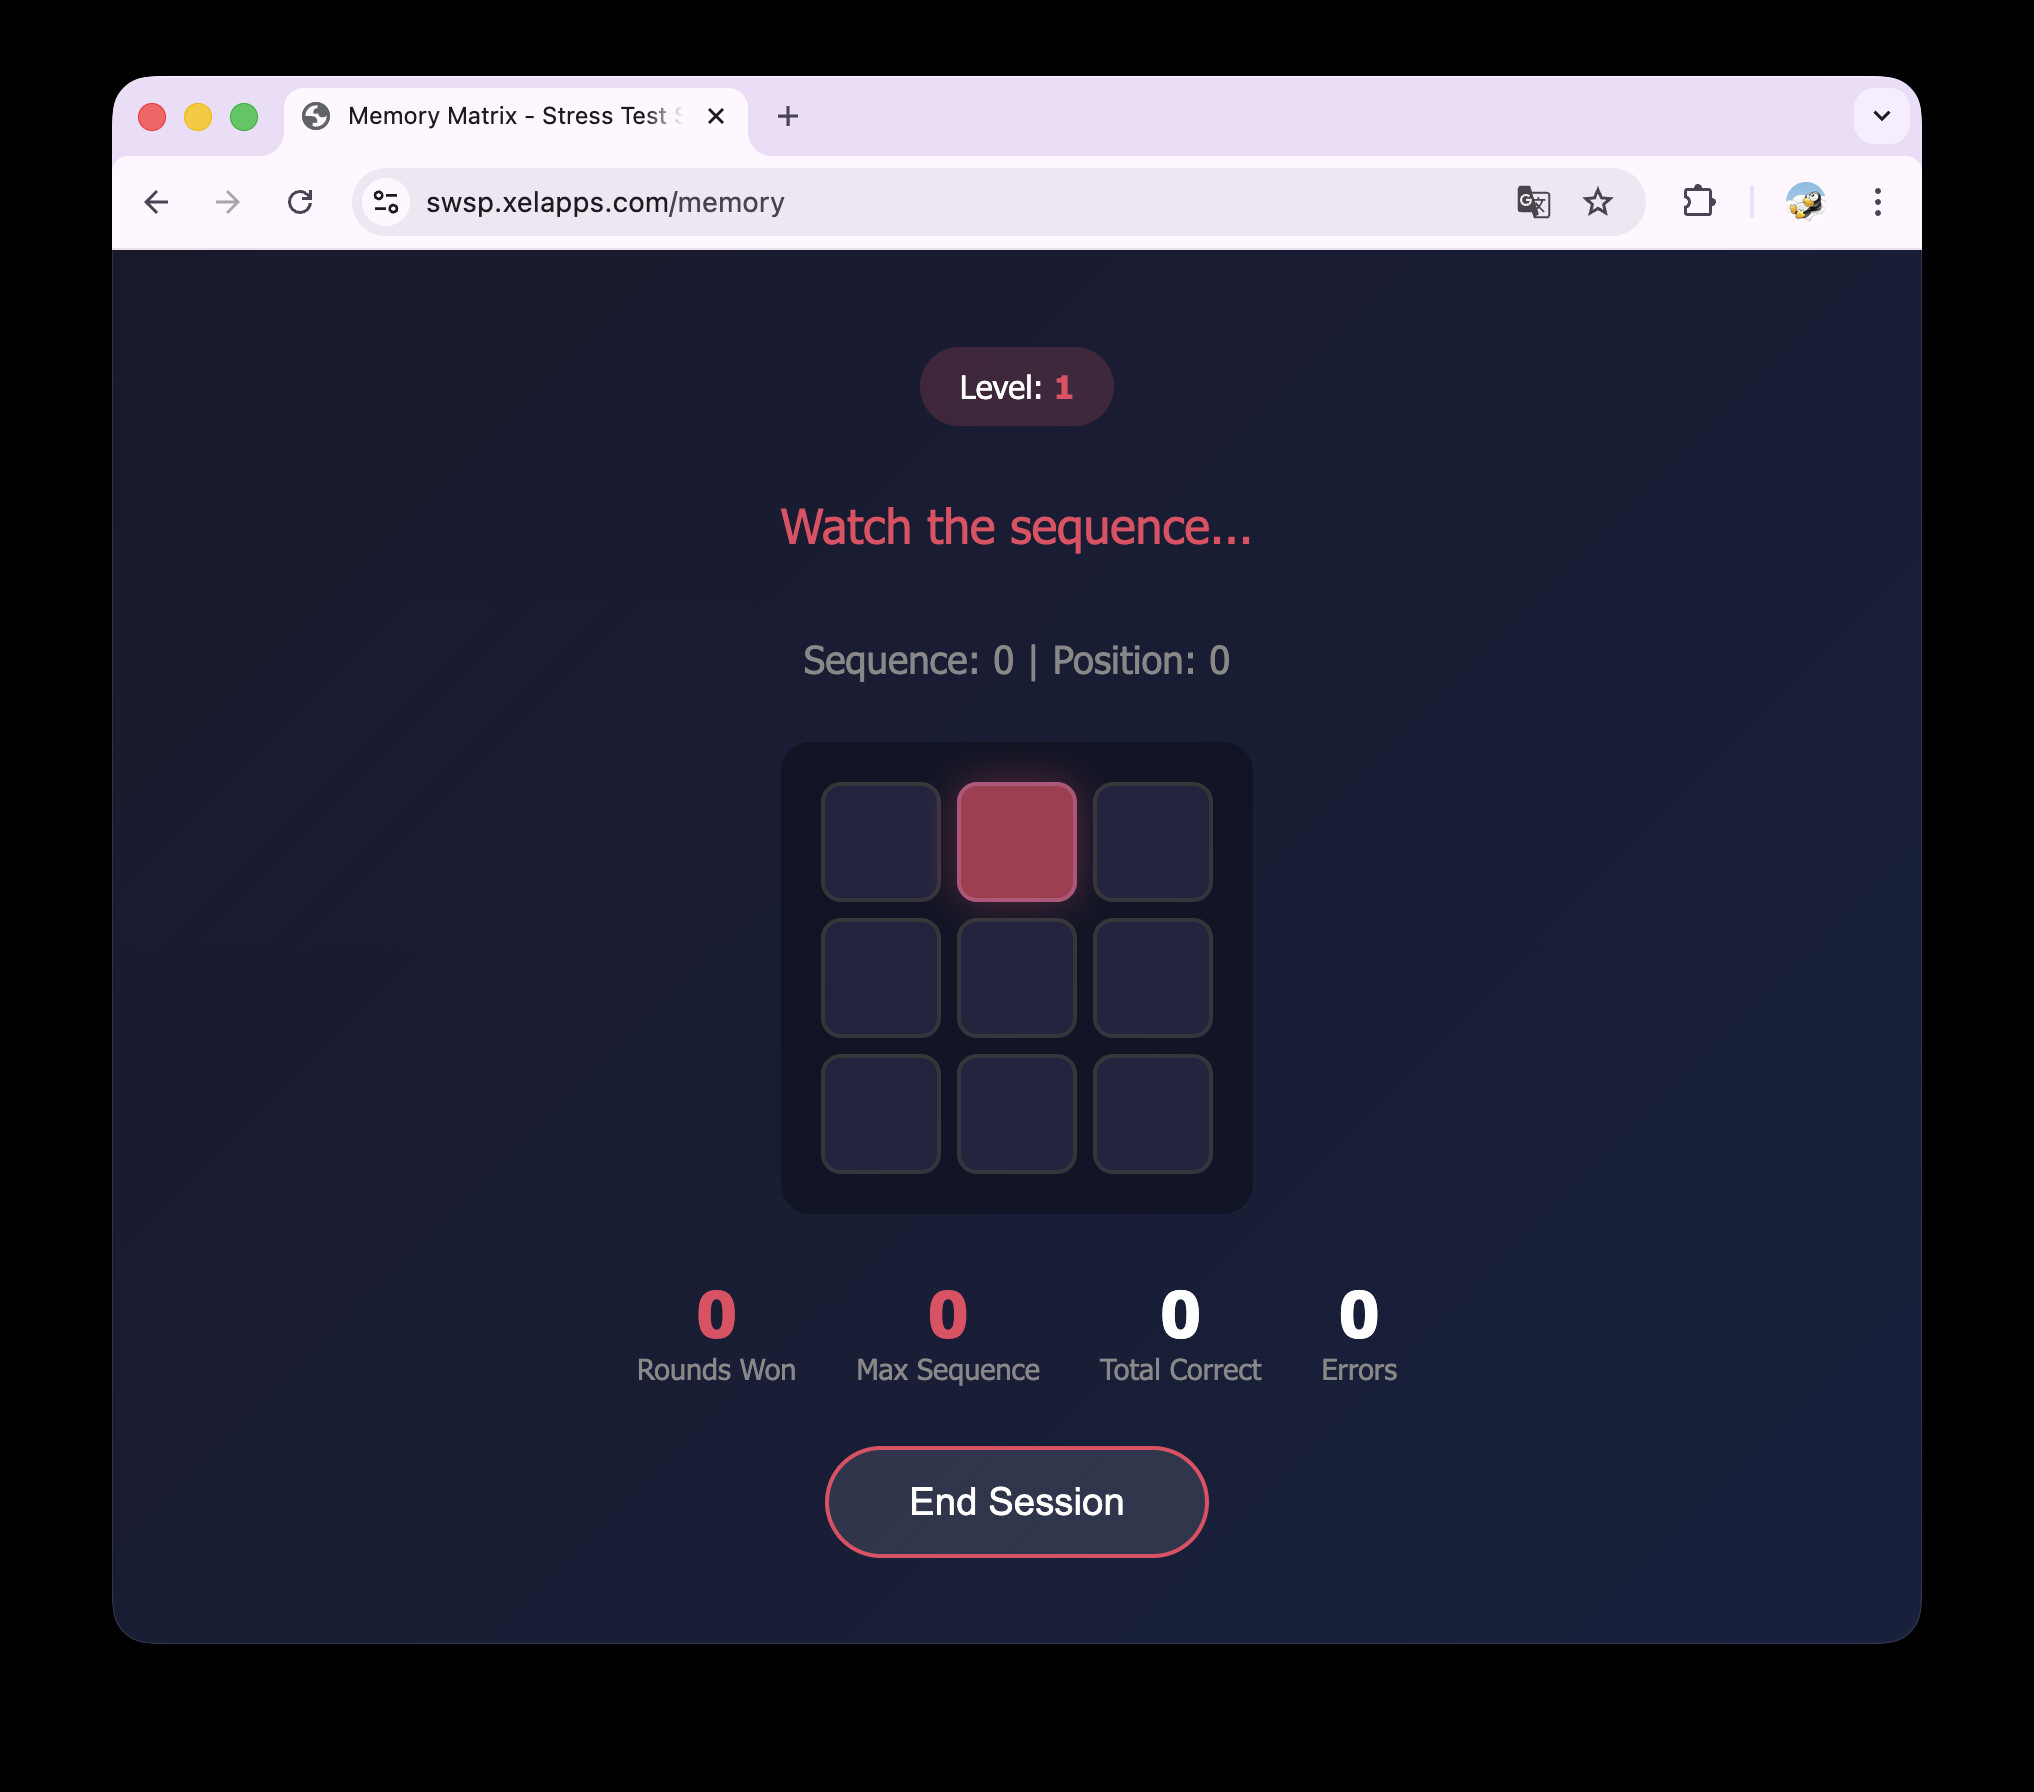
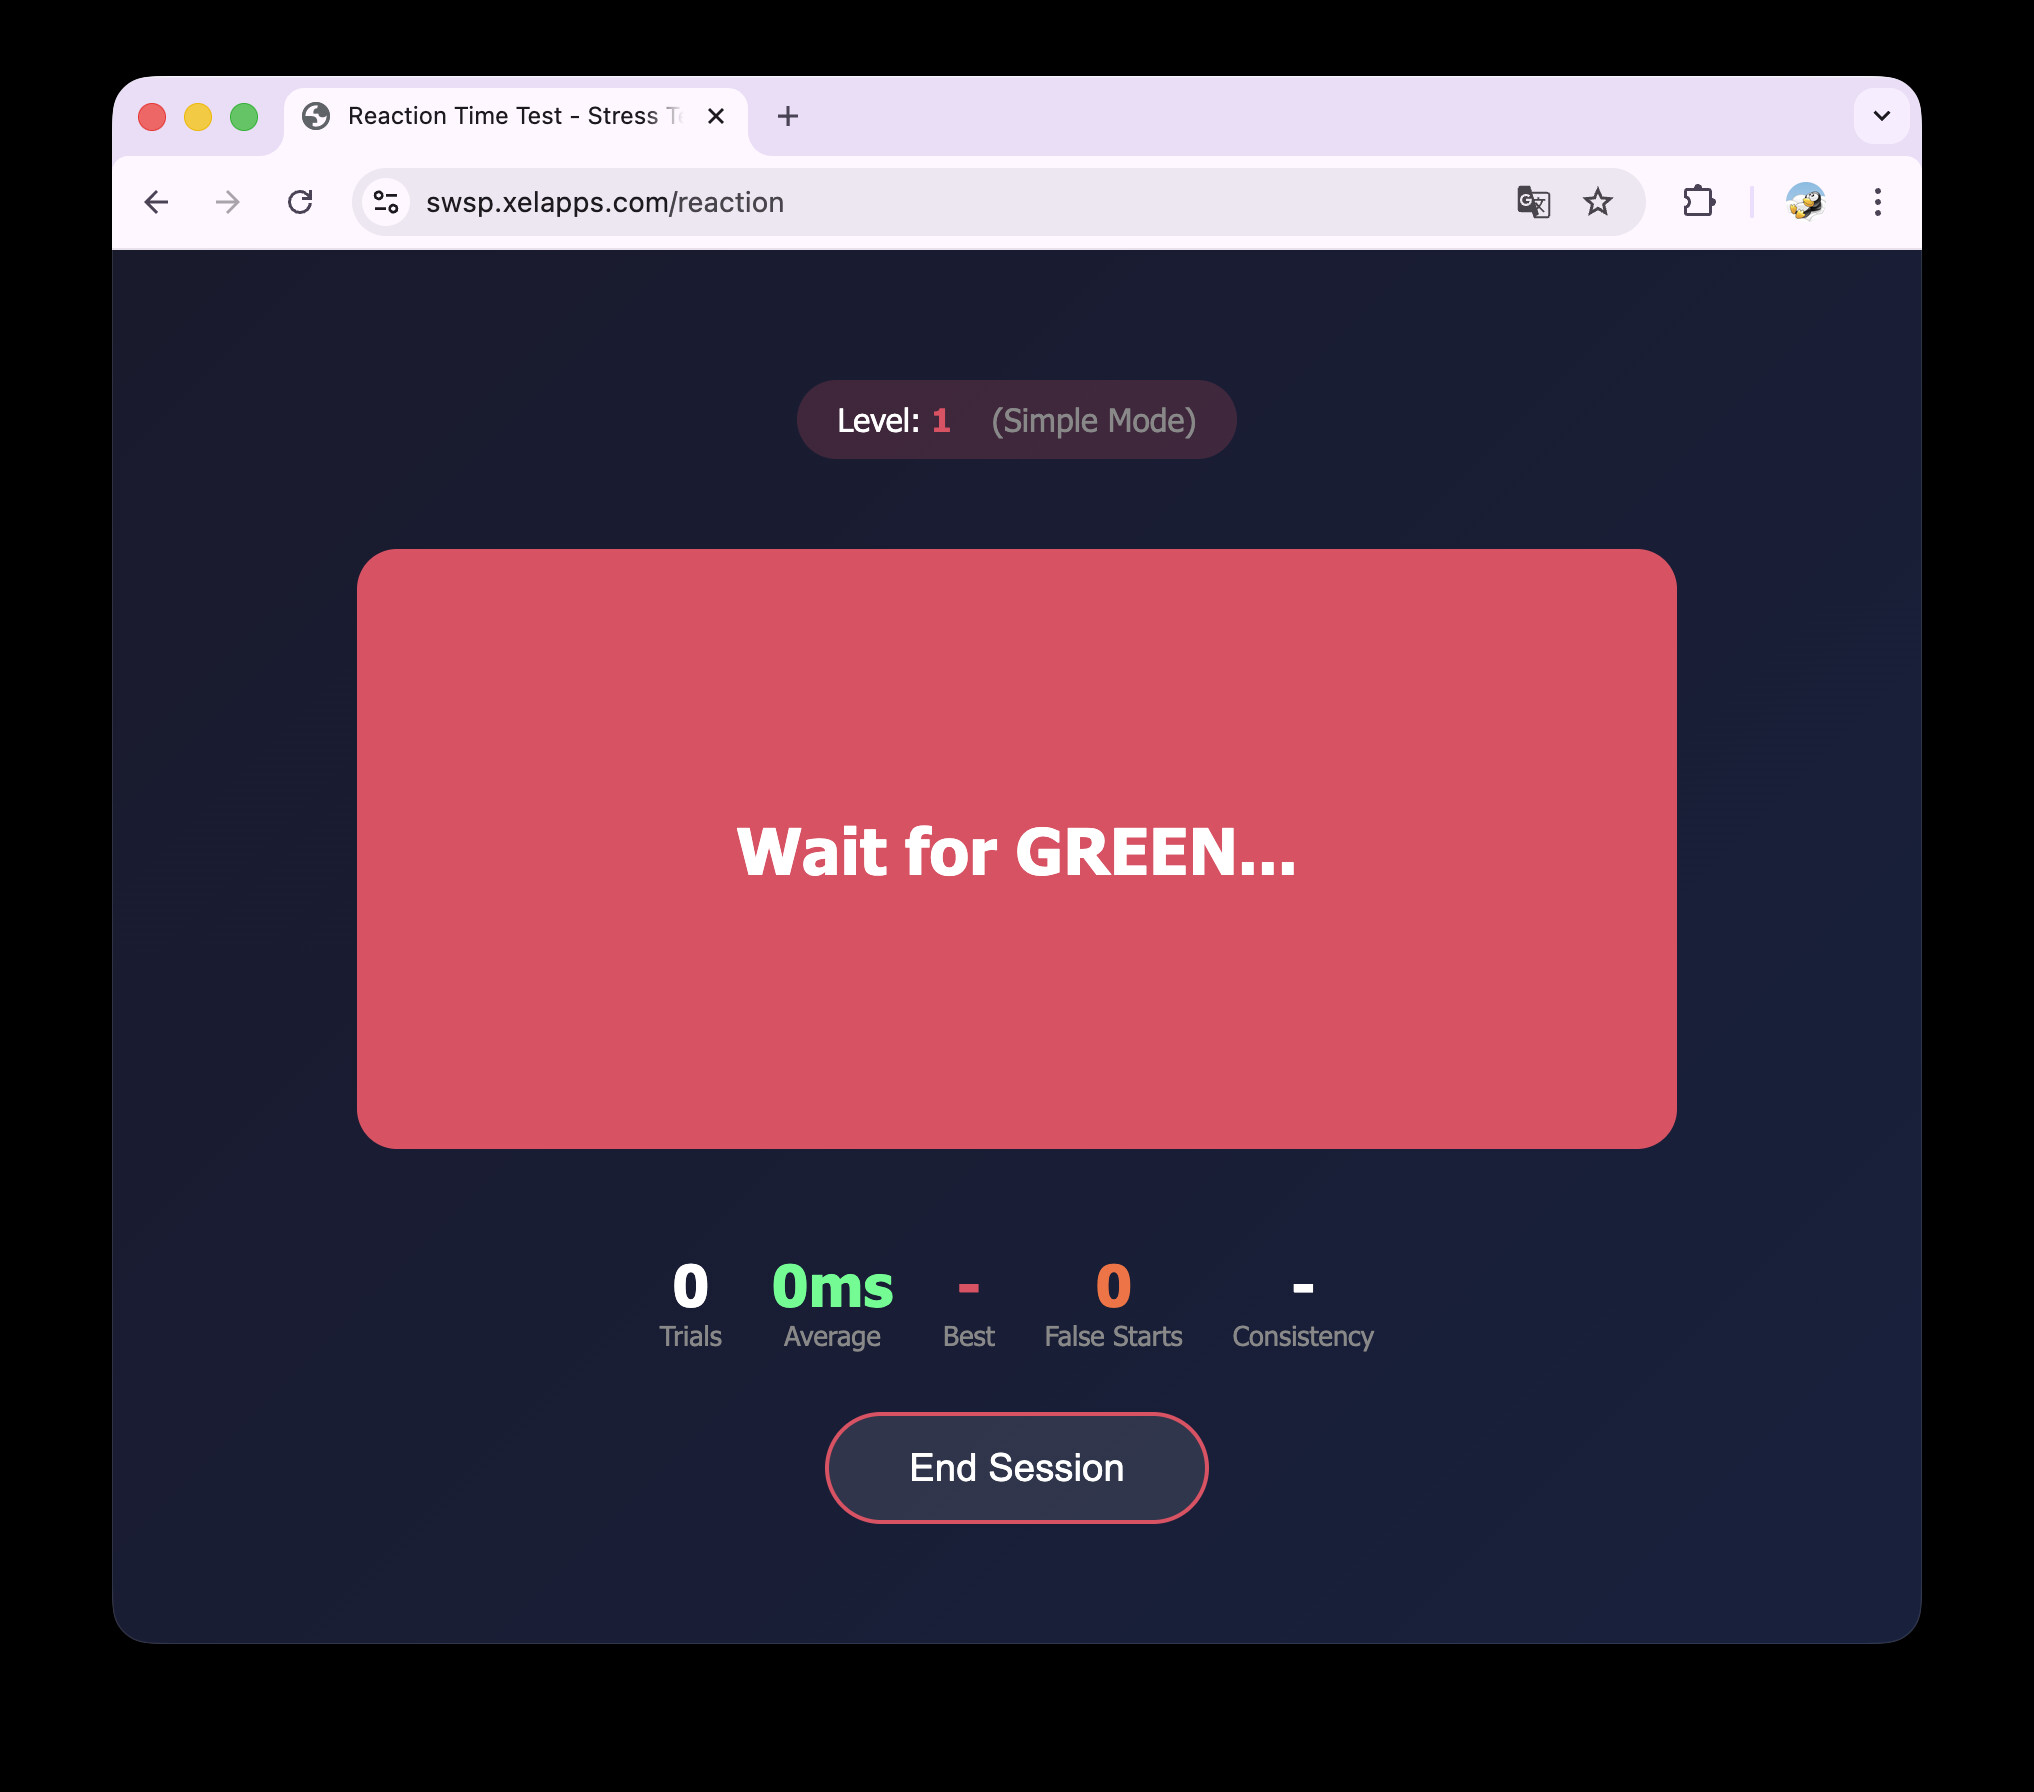
Pipeline smoke test
Real Garmin data recorded, synchronised, windowed, and scored without numerical errors.
N=1 classifier result
Gaming session scored P(stress) ≈ 0.18 — the model saw no shift from the idle baseline.
Boundaries
Ethics, GDPR & limitations
Art. 9 special category data
HR/HRV is health data under GDPR. A 4-point consent gate (privacy policy, storage, age, voluntary) blocks every game until confirmed. No automated clinical decisions (Art. 22). DPIA drafted.
GDPR posture
Local-first, verified in code: the platform makes zero network calls; interaction logs (timestamps, answers, levels) stay in browser localStorage until manually exported to JSON.
One-click revoke wipes every stored key instantly.
Current state
Only WESAD + author's own N=1 data used so far: no third-party participants.
A fuller multi-participant consent framework (pseudonymisation, EEA storage, retention schedule) is already drafted.
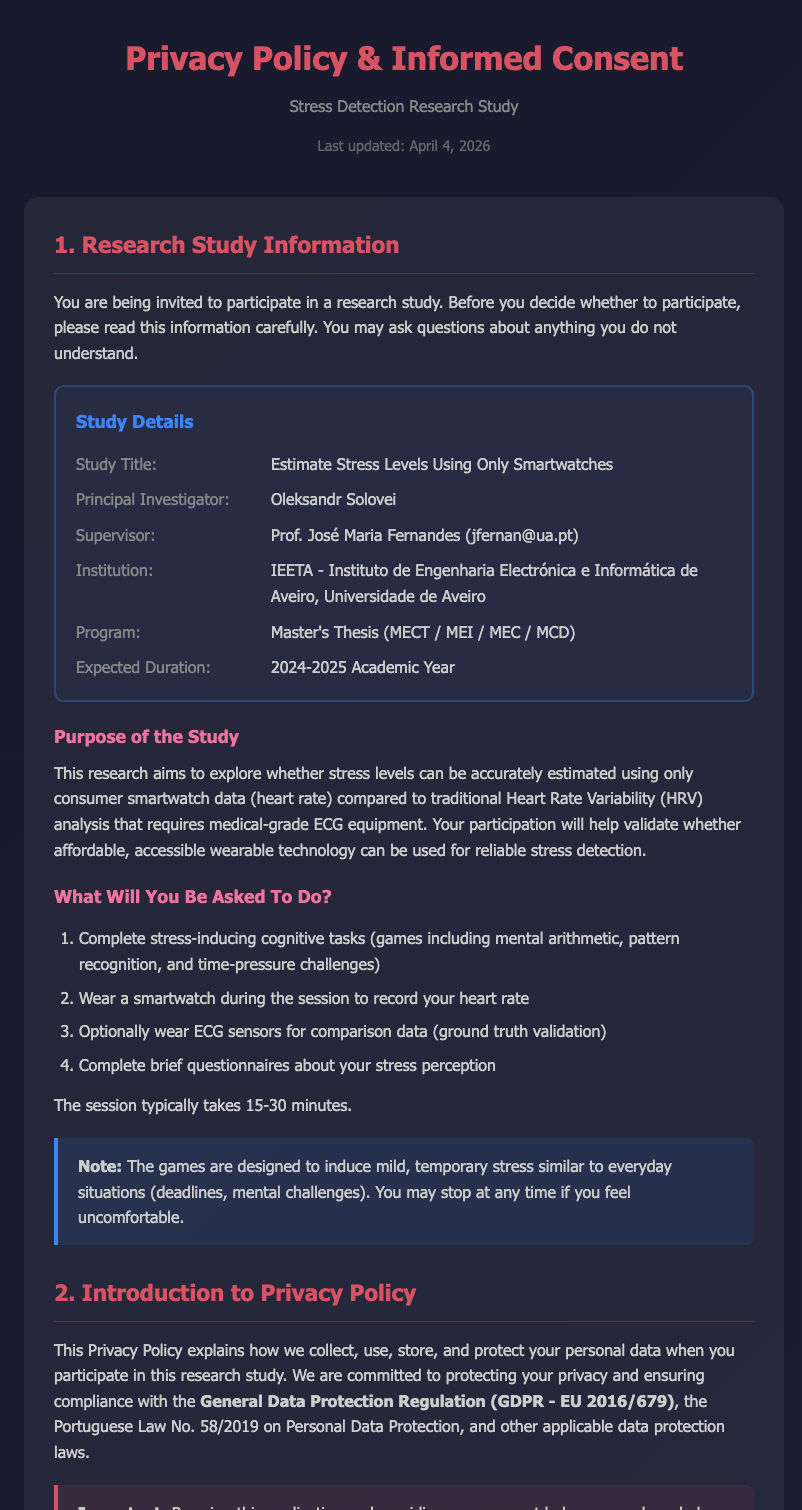
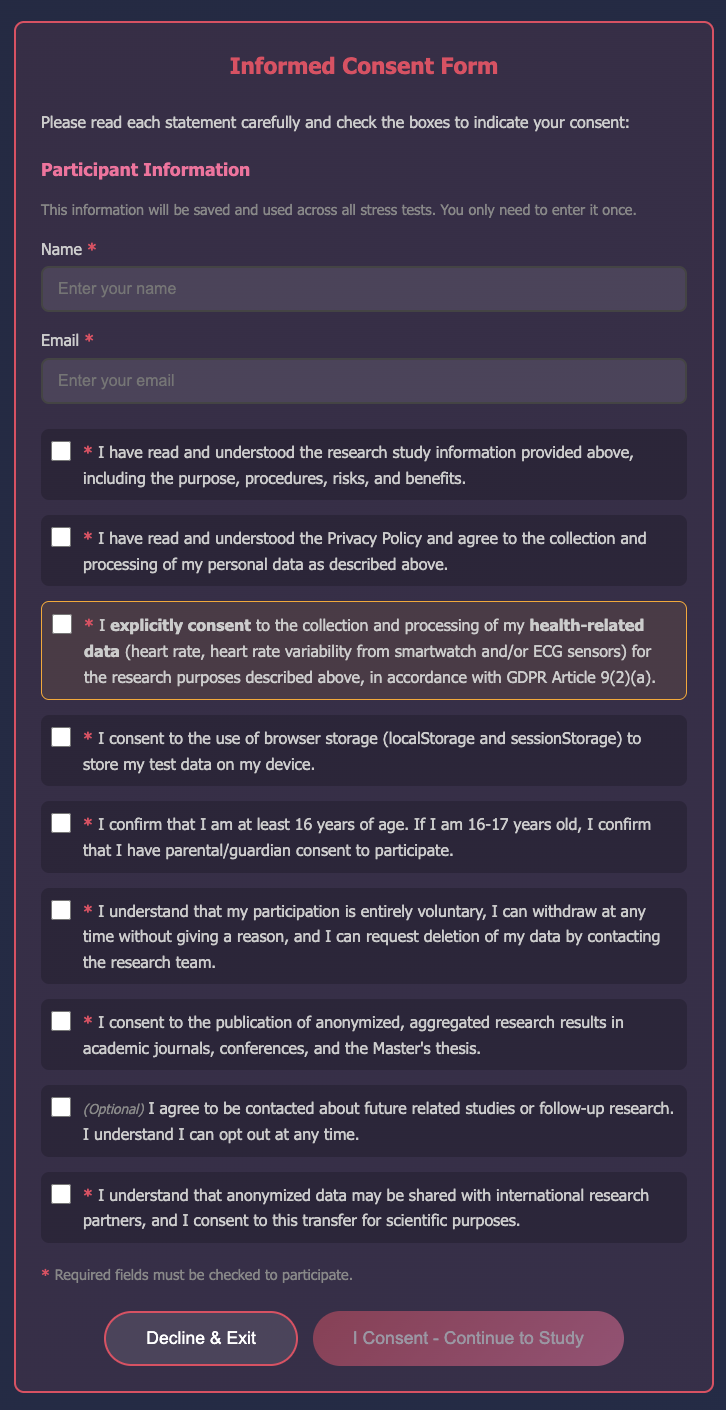
Live consent gate: privacy policy, storage, age, and voluntary-participation checks, enforced before any game starts.
Answer to the research question
Verdict & what's next
Yes, with qualifications.
WESAD-derived 1 Hz signal, LOSO-CV, with per-user calibration
Conditions attached
- Within-subject normalisation
- Subject-independent (LOSO) evaluation
- ~25% need extra personalisation
- Not a substitute for clinical ECG-HRV
- Real-Garmin transfer still to validate
Future work
- Multi-modal fusion (ACC, skin temp, EDA)
- N-of-1 continuous personalisation
- Full CEIC-UA study (10–20 participants)
- On-device linear SVM (Monkey C)
Thank you
Questions welcome.